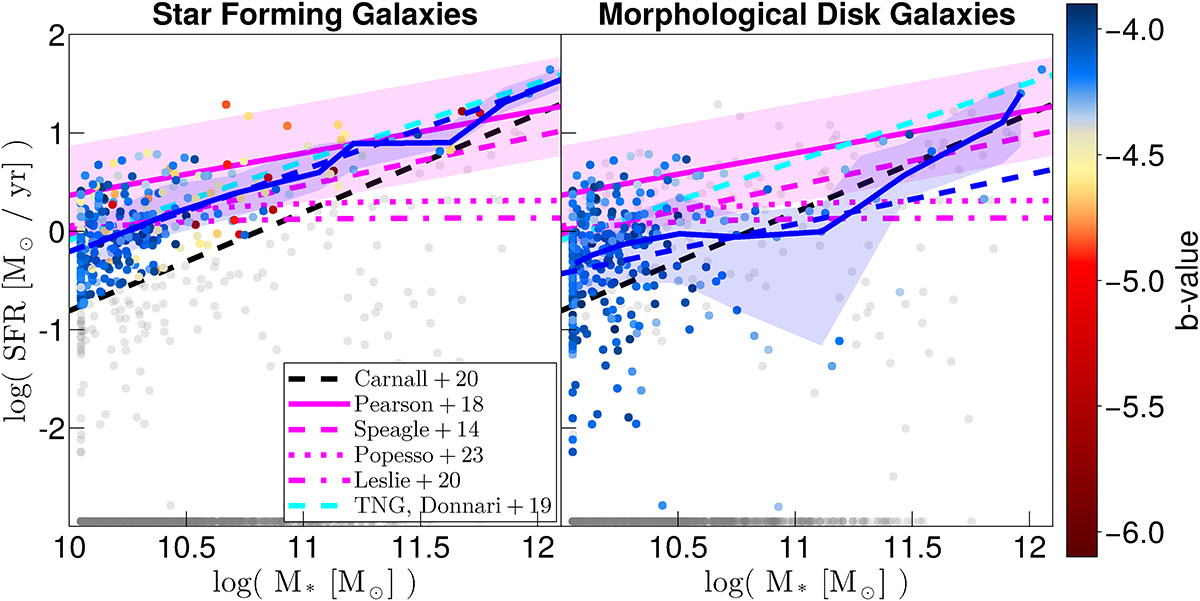
Fig. 1.
Download original image
Star formation main sequence at z ≈ 0. The left- and right-hand panels show the results with respect to two selection criteria for MAGNETICUM galaxies. By imposing a threshold of sSFR > 0.2/tHub (left), as used by Carnall et al. (2020) (dashed black line), we find a slightly higher linear fit to the logarithmic values (dashed blue line) compared to selecting for all kinematic disks with SFR > 0 M⊙/yr (right). Results from observations are displayed in magenta, simulations are shown in blue colors. The solid blue line and shaded region show the running median and 50th percentile region. The circles represent the galaxies from the MAGNETICUM PATHFINDER simulations colored according to their morphology as defined by the b-value (Teklu et al. 2015). Gray circles are ignored for the running median lines on each panel. The SFR values below the range of the figure are fixed to the bottom to represent the full sample in this work. The magenta solid line and shaded region highlights a range of ±0.5 dex around the main sequence fit by Pearson et al. (2018), which we used in this work to distinguish between being on and off the main sequence. The other magenta lines are additional observational results: dashed line (Speagle et al. 2014), dash-dotted line (Leslie et al. 2020), and dotted line (Popesso et al. 2023). The dashed cyan line marks the results from ILLUSTRISTNG by Donnari et al. (2019a).
Current usage metrics show cumulative count of Article Views (full-text article views including HTML views, PDF and ePub downloads, according to the available data) and Abstracts Views on Vision4Press platform.
Data correspond to usage on the plateform after 2015. The current usage metrics is available 48-96 hours after online publication and is updated daily on week days.
Initial download of the metrics may take a while.