Fig. 11.
Download original image
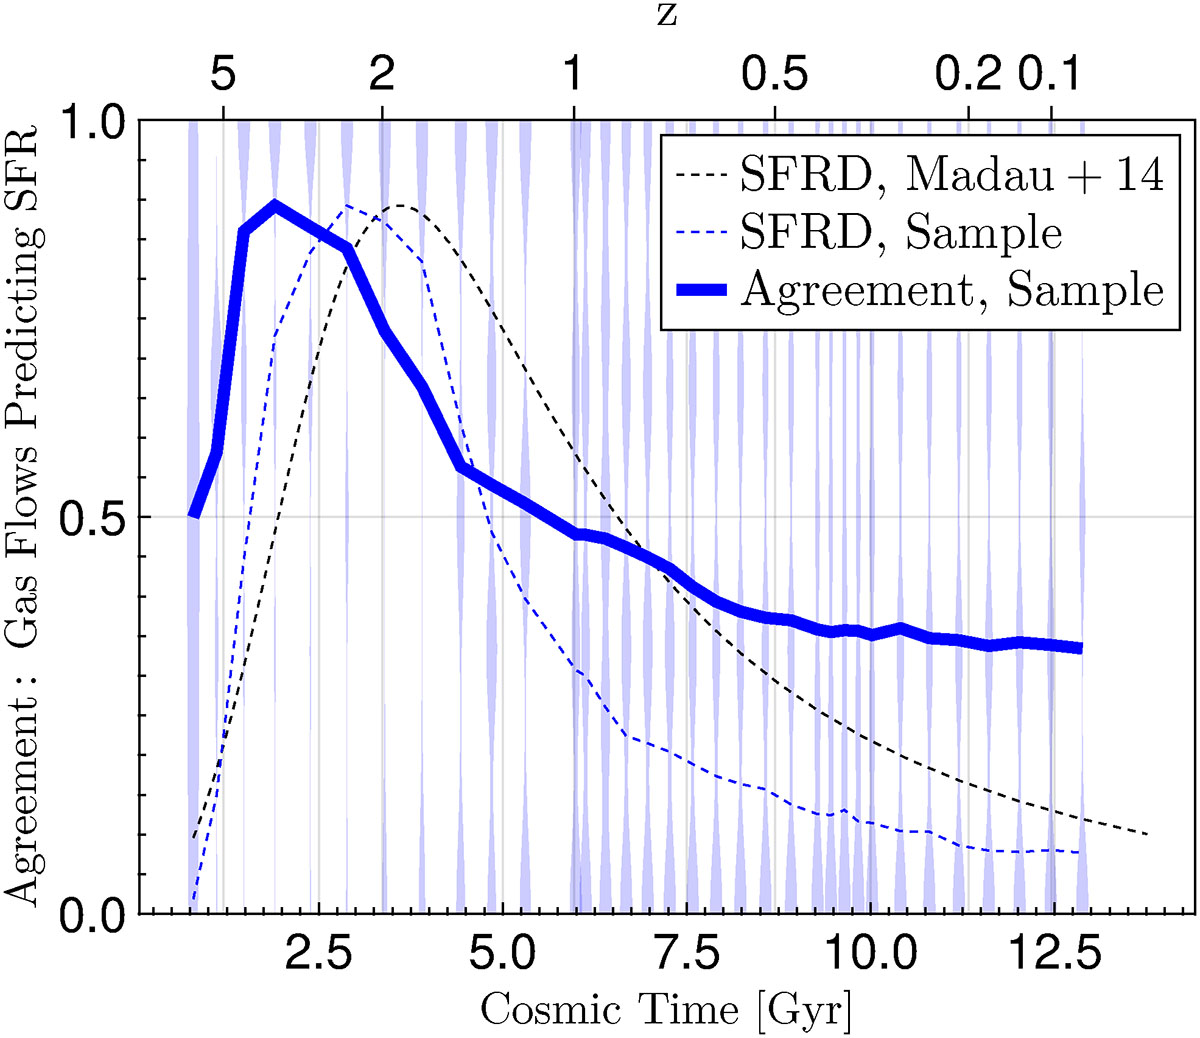
Violin plot indicating the mean agreement of expectations from net accretion and the SFRs derived from Equation (1) with simulation output. An agreement is registered when both values deviate less than 0.5 dex from each other or for quenched galaxies, when simulation output and derived values return any SFR below 10−3 M⊙/yr. The vertical histograms (violins) count the agreement fraction of each galaxy within 500 Myr before and after each snapshot, combining three to four snapshot data points. This produces discretized fractions accumulating at 0.0, 0.25, 0.3, 0.5, 0.7, 0.75, and 1. The solid line follows the mean values within each bin. The blue dashed line shows the evolution of the SFR density of the galaxy sample normalized to the range of the figure. The black dashed line shows observational results for the evolution of the SFRD compiled by Madau & Dickinson (2014) and was normalized as well.
Current usage metrics show cumulative count of Article Views (full-text article views including HTML views, PDF and ePub downloads, according to the available data) and Abstracts Views on Vision4Press platform.
Data correspond to usage on the plateform after 2015. The current usage metrics is available 48-96 hours after online publication and is updated daily on week days.
Initial download of the metrics may take a while.