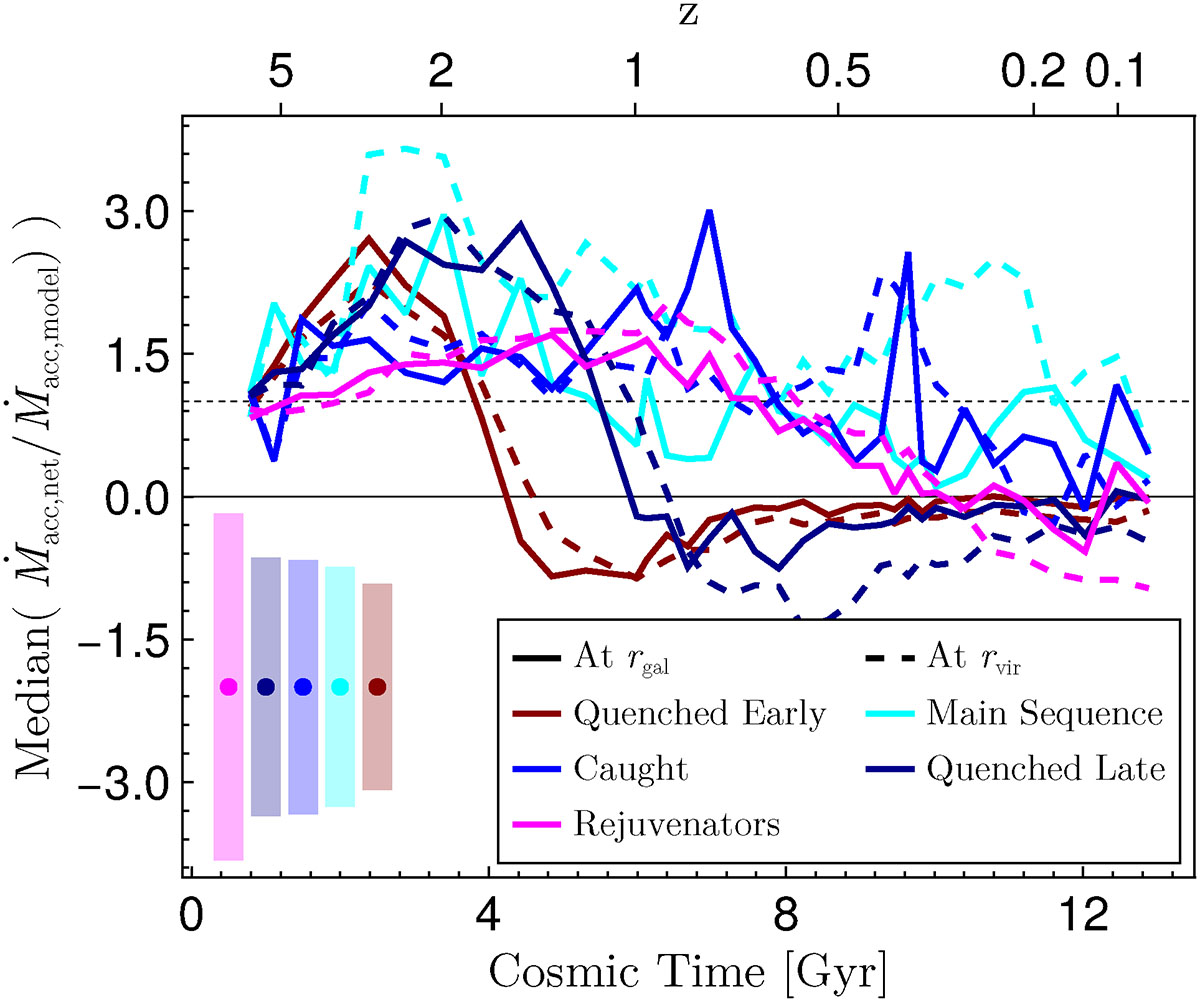
Fig. B.1.
Download original image
Median net gas accretion history evolution of each formation class across cosmic time. We show the net accretion rates at the virial radii as dashed lines and as solid lines accretion rates onto the center of the halos at ten percent virial radius. Prior to combining the data, we normalized each accretion rate value by halo mass and redshift according to expectations from dark-matter assembly (Dekel et al. 2009). The horizontal dashed black line at a value of one highlights this expectation by definition. The median of main-sequence galaxies are in cyan, quenched in dark red, rejuvenating galaxies in magenta and caught galaxies in blue colors. The vertical bars outline a representative 50th percentile scatter. On average, accretion rates generally do not differ too much from the expectations. Quenching galaxies collectively assume negative values correlating with the time of quenching of their star formation. This correlation becomes evident from comparing the early- and late-quenching galaxy populations.
Current usage metrics show cumulative count of Article Views (full-text article views including HTML views, PDF and ePub downloads, according to the available data) and Abstracts Views on Vision4Press platform.
Data correspond to usage on the plateform after 2015. The current usage metrics is available 48-96 hours after online publication and is updated daily on week days.
Initial download of the metrics may take a while.