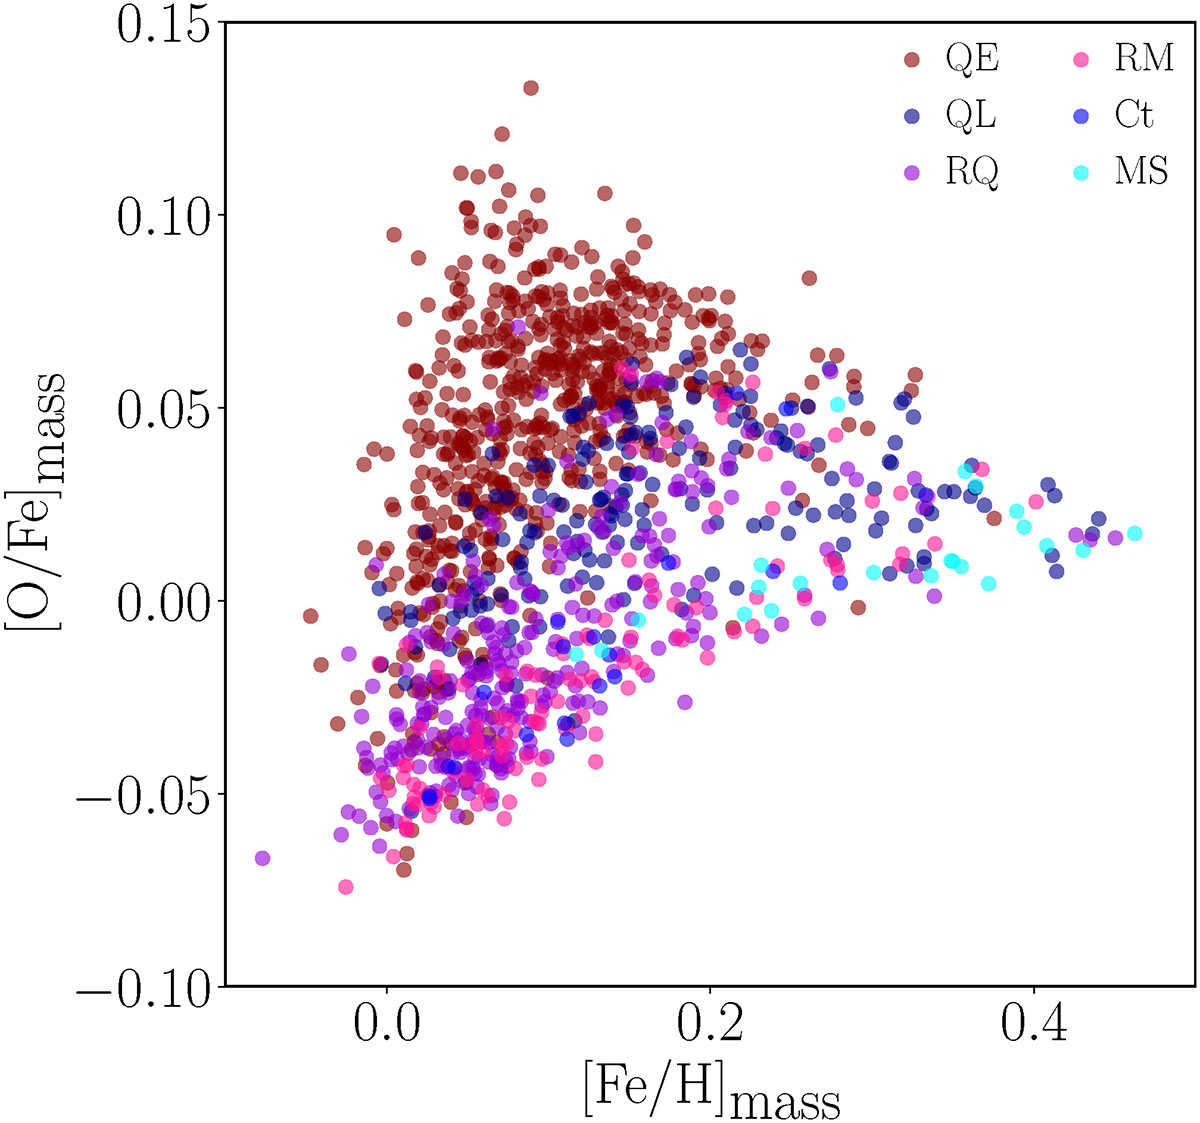
Fig. 8.
Download original image
Mean stellar abundance ratios of the galaxy sample at z ≈ 0. Oxygen was chosen to represent α enrichment. Akin to Figure 7, different regions of the diagram are predominantly occupied by specific classes. A clear gradient emerges from the top left to the bottom right of the distribution as QE-QL-RQ-Ct-RM-MS. Main-sequence-type galaxies tend to the right-most corner of the distribution.
Current usage metrics show cumulative count of Article Views (full-text article views including HTML views, PDF and ePub downloads, according to the available data) and Abstracts Views on Vision4Press platform.
Data correspond to usage on the plateform after 2015. The current usage metrics is available 48-96 hours after online publication and is updated daily on week days.
Initial download of the metrics may take a while.