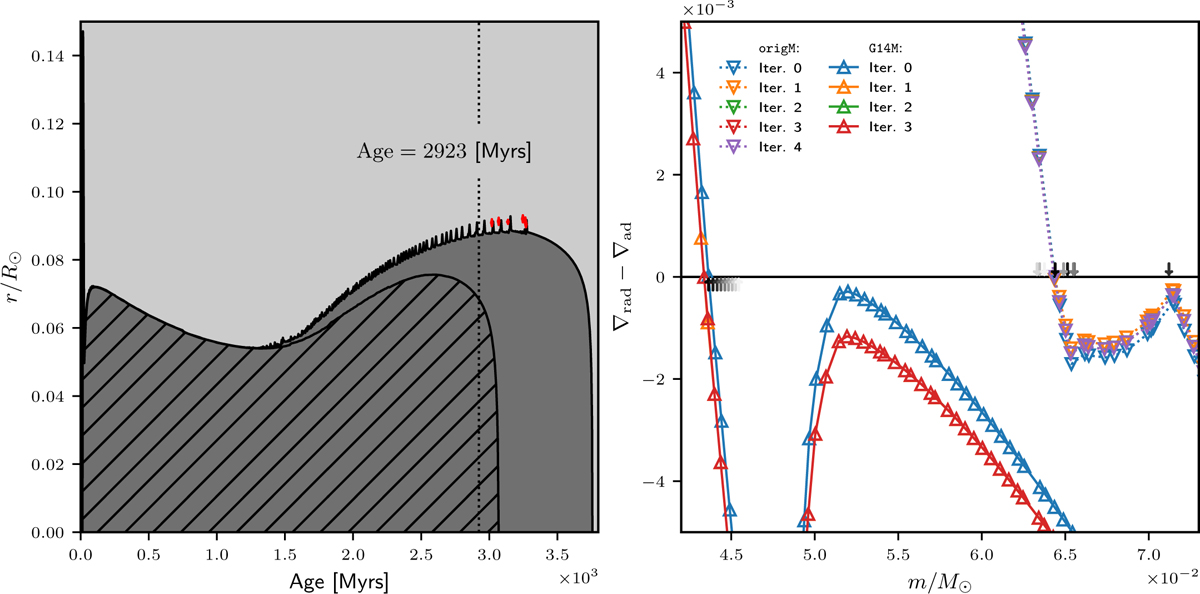
Fig. 2
Download original image
Left panel: Kippenhahn diagram of two models of 1.3 M⊙ computed with the method originally implemented in CESAM (Morel 1997, hereafter model OrigM), and with the method prescribed by Gabriel et al. (2014, hereafter model G14M) and now implemented in Cesam2k20. The radiative zone corresponds to dark grey region for OrigM, and hatched region for G14M. Convective zone is the region in light grey for OrigM, and non-hatched region for G14M. Red regions are spurious convective zone. Vertical dashed line at age 2923 Myrs marks the position in time of the model represented on right. Right panel: profile of d∇ ≡ ∇rad − ∇ad as a function of the mass coordinate, m/M⊙, at each iteration of a given time step (at age 2923 Myrs). Profiles for G14M are drawn in solid lines, and profiles for OrigM are in dashed lines. Up (G14M) or down (OrigM) triangles mark the location of each layer, at each iteration. Grey up (G14M) or down (OrigM) arrows mark the location of the convective boundary at the ten previous time steps. Lightest arrow if for the tenth previous time step and darkest arrow for the immediate previous one.
Current usage metrics show cumulative count of Article Views (full-text article views including HTML views, PDF and ePub downloads, according to the available data) and Abstracts Views on Vision4Press platform.
Data correspond to usage on the plateform after 2015. The current usage metrics is available 48-96 hours after online publication and is updated daily on week days.
Initial download of the metrics may take a while.