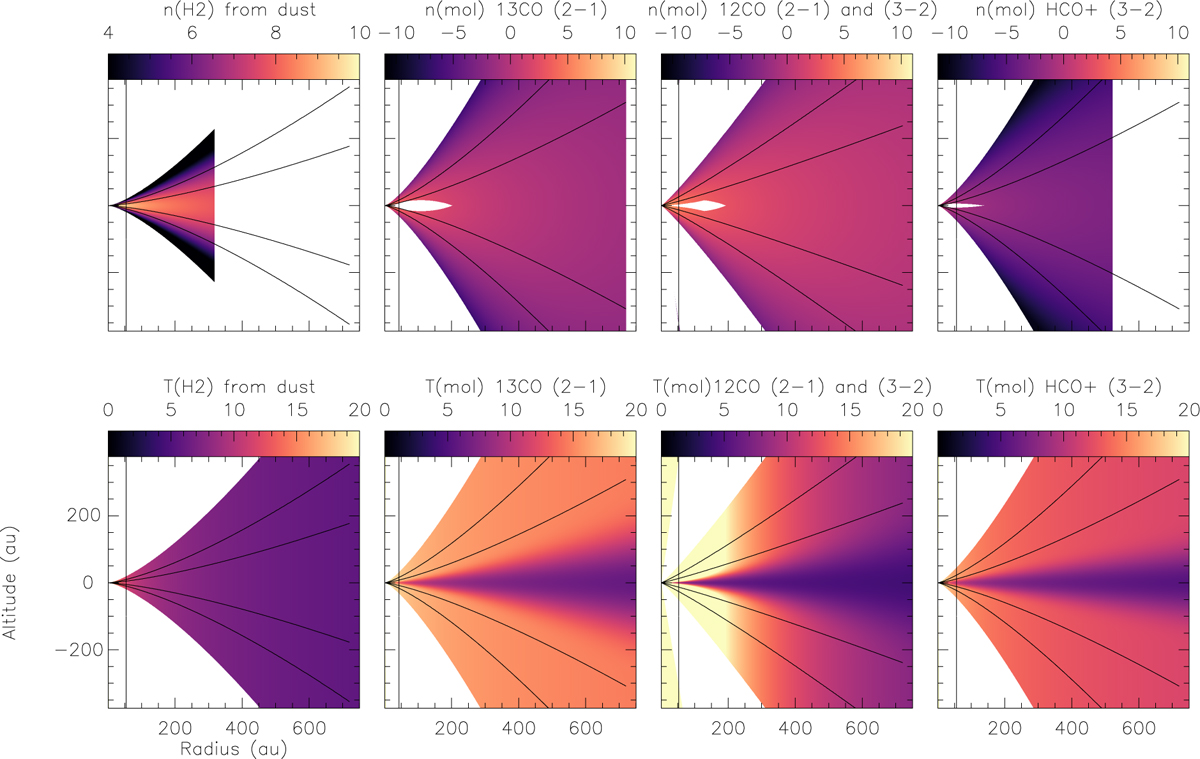
Fig. B.1
Download original image
Density profile on the first row and temperature profile on the second, for the DiskFit best models. The 1st column is for dust, the 2nd for 13CO, the 3rd for 12CO (2-1) and (3-2) and the 4th for HCO+. The solid vertical line represents the beam, and the curved horizontal lines correspond to one and two scale heights. Note: the density profile scale (in cm−3) is expressed in log10. The densities shown for the molecular tracers correspond to the number density of the specific molecule, not the total H2 density, and are therefore several orders of magnitude lower than dust-derived gas densities.
Current usage metrics show cumulative count of Article Views (full-text article views including HTML views, PDF and ePub downloads, according to the available data) and Abstracts Views on Vision4Press platform.
Data correspond to usage on the plateform after 2015. The current usage metrics is available 48-96 hours after online publication and is updated daily on week days.
Initial download of the metrics may take a while.