Open Access
Fig. B.2
Download original image
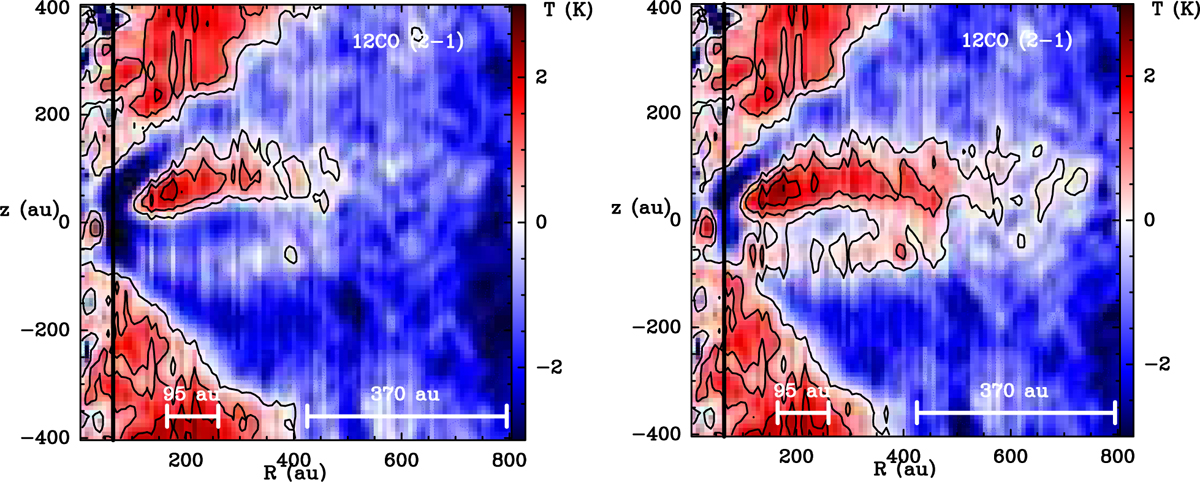
Differences TRD (observation TRD - model TRD) of the 12CO 2-1 emission after fitting a model with depletion (on the left) and without depletion (on the right). Color scale spans and contours are defined from −3 K to 3 K in steps of 1 K.
Current usage metrics show cumulative count of Article Views (full-text article views including HTML views, PDF and ePub downloads, according to the available data) and Abstracts Views on Vision4Press platform.
Data correspond to usage on the plateform after 2015. The current usage metrics is available 48-96 hours after online publication and is updated daily on week days.
Initial download of the metrics may take a while.