Fig. 2
Download original image
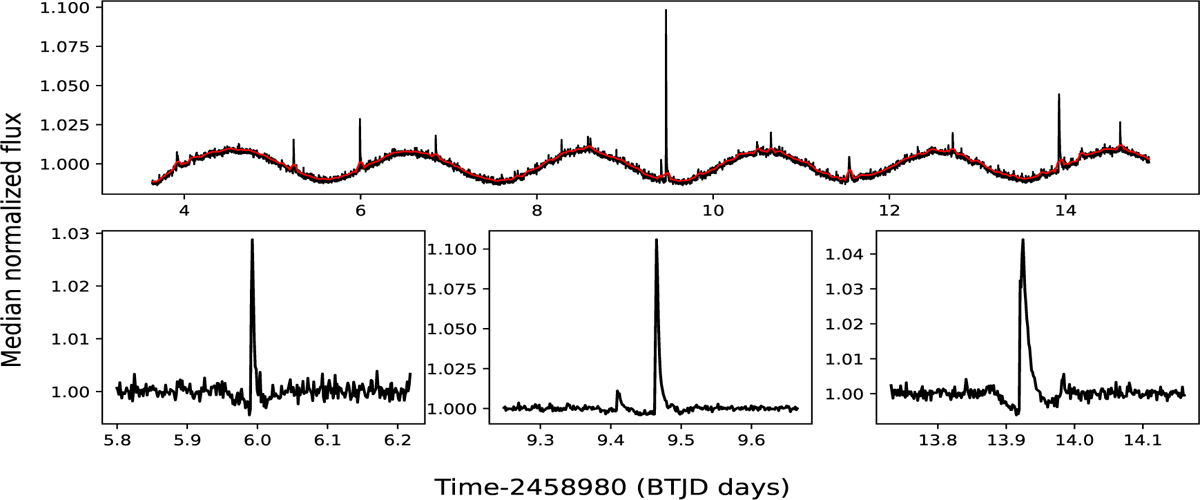
Top panel: TESS light curve of PM J16170+5516 (M2.0) from Sector-25, 2020 (SPOC) with Prot 1.975 days. The black line shows the light curve with a cadence of 2 min, and the red line represents the Savitzky–Golay filtered and smoothed curve. Bottom panels: zoomed views of the detrended flux highlighting multiple flare events of different magnitudes.
Current usage metrics show cumulative count of Article Views (full-text article views including HTML views, PDF and ePub downloads, according to the available data) and Abstracts Views on Vision4Press platform.
Data correspond to usage on the plateform after 2015. The current usage metrics is available 48-96 hours after online publication and is updated daily on week days.
Initial download of the metrics may take a while.