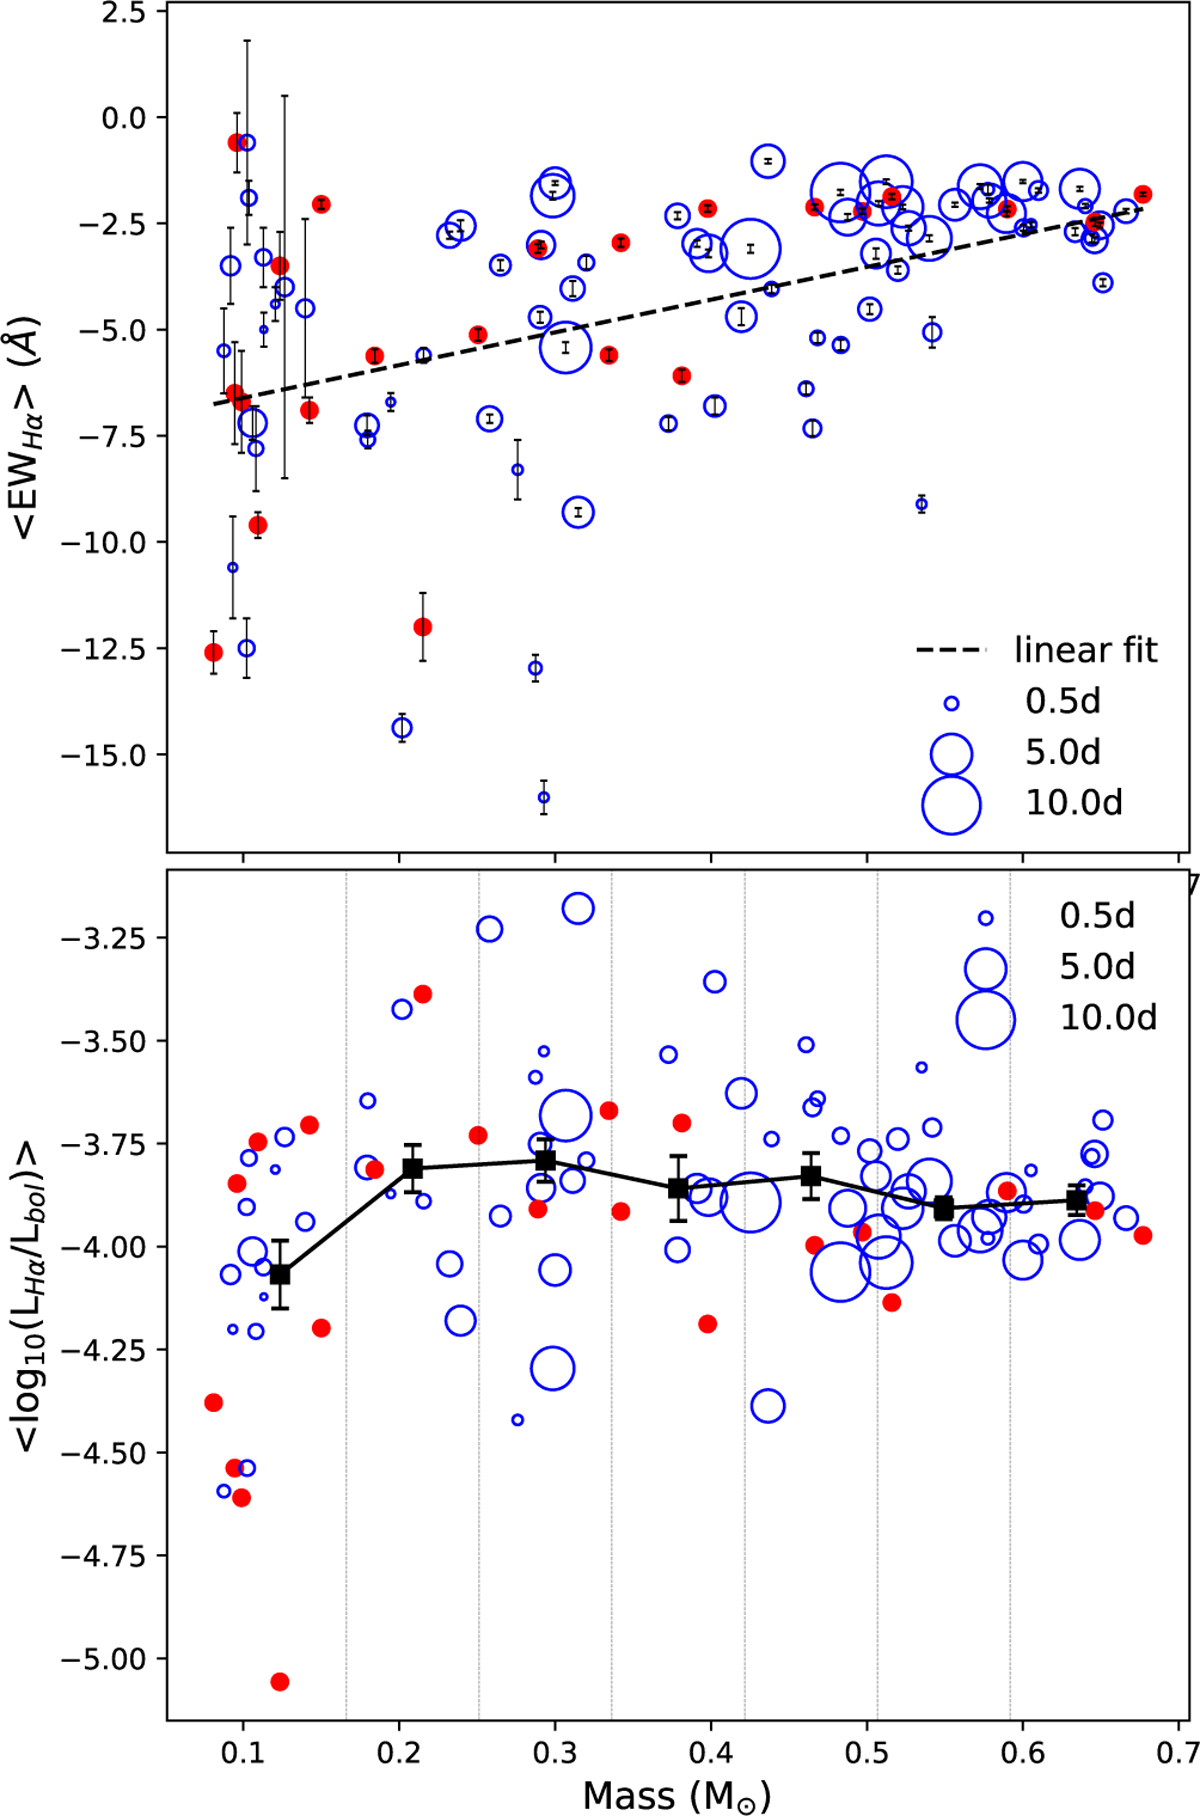
Fig. 4
Download original image
Variability and activity indicators as a function of stellar mass. Top panel: Distribution of ΔEW = max(EW) – min(EW) for Hα emission. The dashed black line shows a linear fit, ΔEWHα = a(M*) + b, with a = 7.71 ± 1.55, b = −7.38 ± 0.64. Bottom panel: Median values of log10(LHα/Lbol) for Hα emission as a function of stellar mass. The black squares mark the medians in seven equally spaced bins with scatter quantified using the median absolute deviation. The blue circles are scaled by Prot, and larger circles correspond to longer Prot. The filled red circles indicate stars without a measured rotation period. The vertical gray lines show the bin sizes.
Current usage metrics show cumulative count of Article Views (full-text article views including HTML views, PDF and ePub downloads, according to the available data) and Abstracts Views on Vision4Press platform.
Data correspond to usage on the plateform after 2015. The current usage metrics is available 48-96 hours after online publication and is updated daily on week days.
Initial download of the metrics may take a while.