Open Access
Fig. 7
Download original image
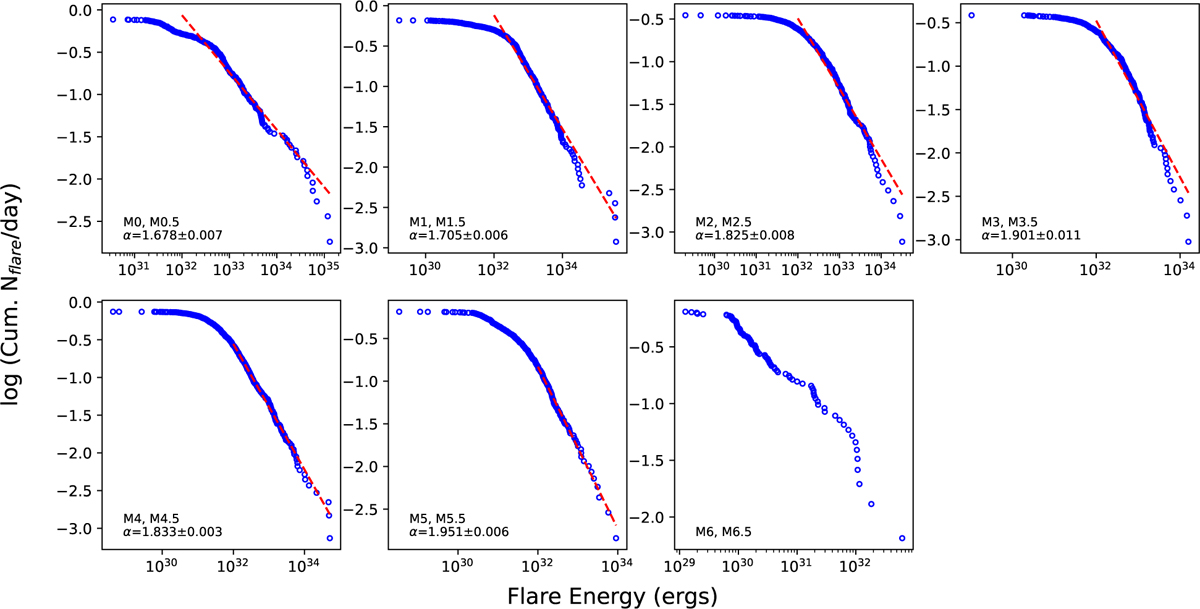
Cumulative flare frequency distribution for M dwarfs plotted as a function of flare energy for the spectral types. The dashed red line shows the power-law fit (see Section 3.4). For the M6–M6.5 sample, no fit is shown because there were too few flares.
Current usage metrics show cumulative count of Article Views (full-text article views including HTML views, PDF and ePub downloads, according to the available data) and Abstracts Views on Vision4Press platform.
Data correspond to usage on the plateform after 2015. The current usage metrics is available 48-96 hours after online publication and is updated daily on week days.
Initial download of the metrics may take a while.