Open Access
Fig. 9
Download original image
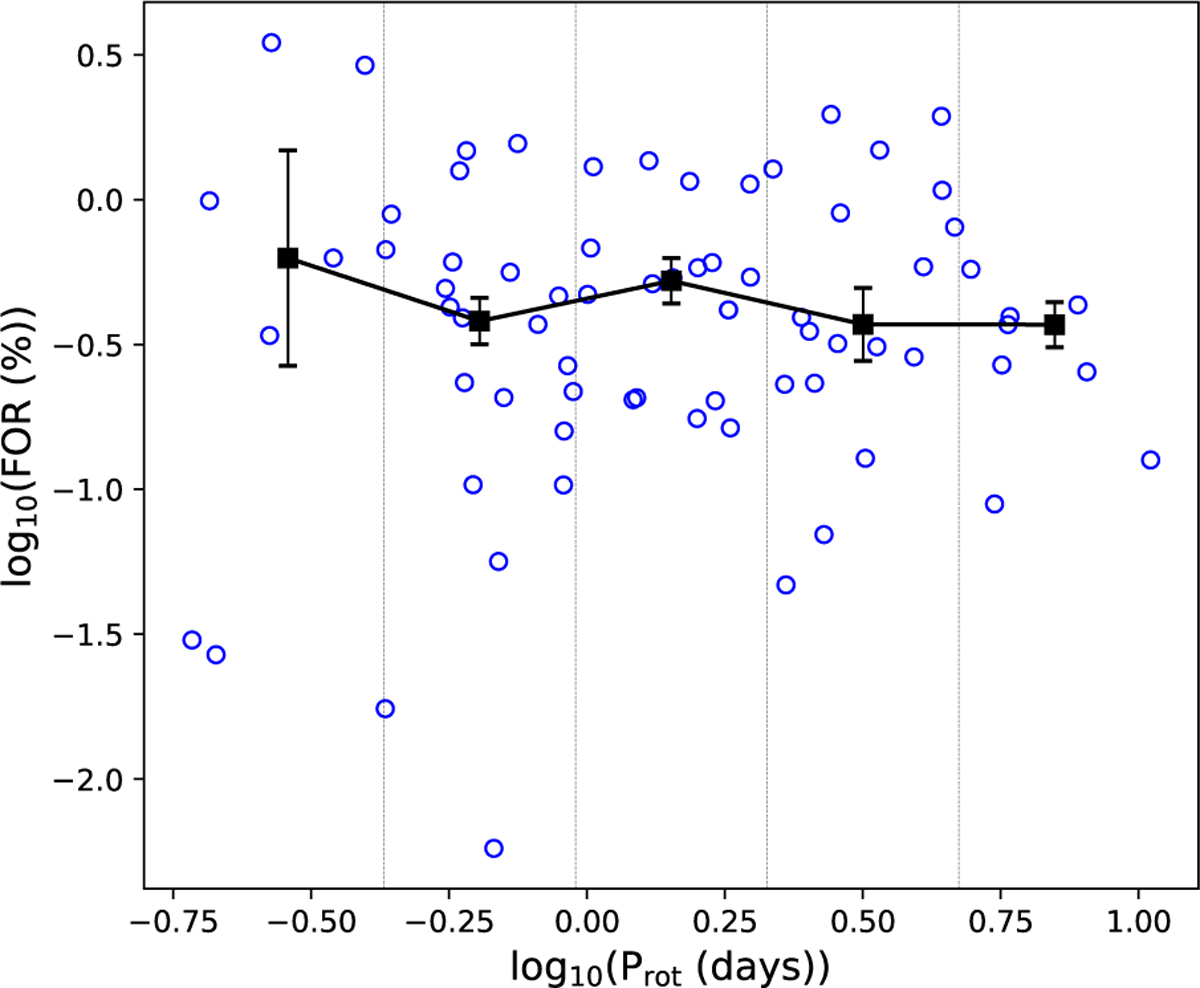
FOR as a function of Prot. The blue circles represent individual stars. The black square marks the median values in five equally spaced bins on a log scale. The error bars on the medians are discussed in Section 4.2.
Current usage metrics show cumulative count of Article Views (full-text article views including HTML views, PDF and ePub downloads, according to the available data) and Abstracts Views on Vision4Press platform.
Data correspond to usage on the plateform after 2015. The current usage metrics is available 48-96 hours after online publication and is updated daily on week days.
Initial download of the metrics may take a while.