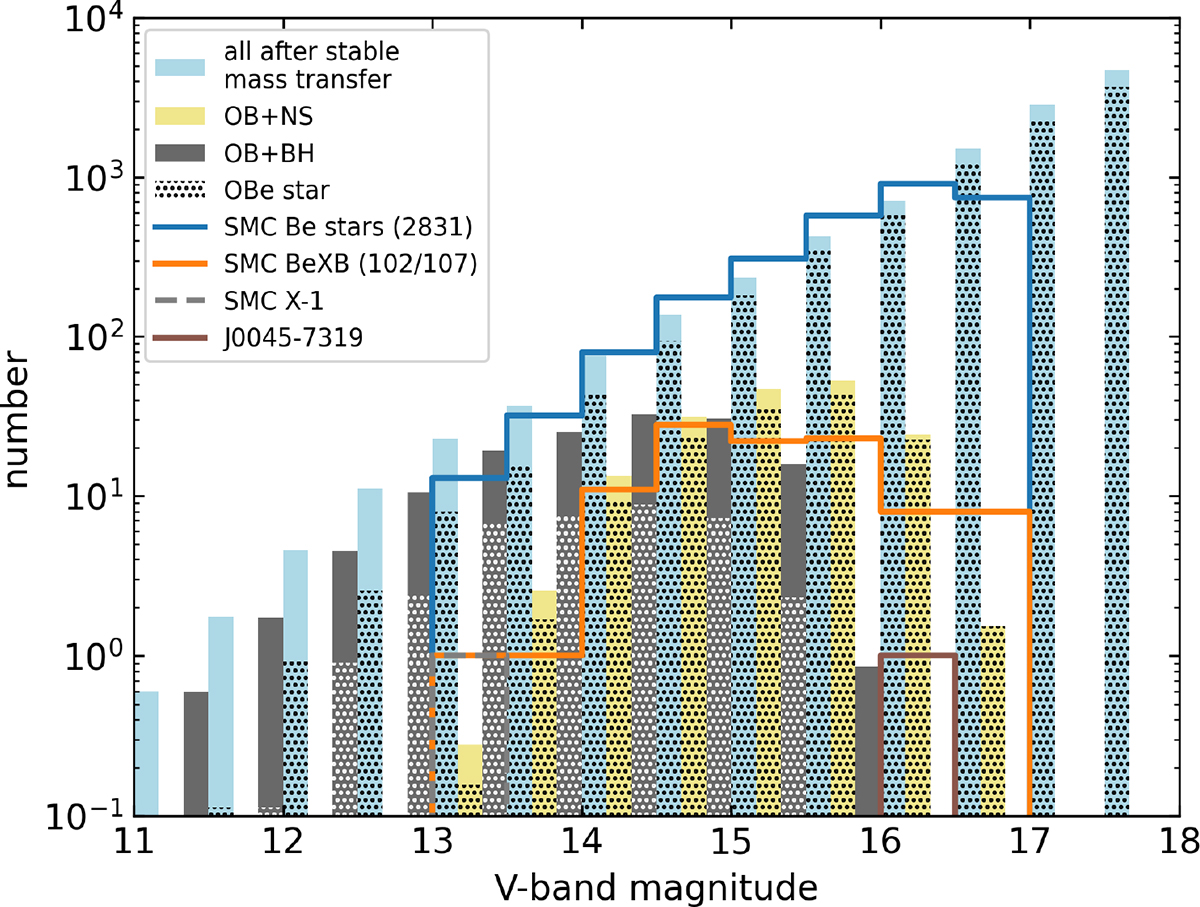
Fig. 10.
Download original image
Predicted and observed distribution of V-band magnitudes. The blue bars show the magnitudes of all OB star models (i.e. with HeS, WD, NS, and BH companion and unbound systems) after stable mass transfer. OBe candidates are marked with dots. As observations we show the SMC OBe magnitudes distribution (blue line) from Schootemeijer et al. (2022), the magnitudes of BeXBs (orange line) from Haberl & Sturm (2016)2, SMC X-1 (grey dashed line) and J0045-7319 (brown line).
Current usage metrics show cumulative count of Article Views (full-text article views including HTML views, PDF and ePub downloads, according to the available data) and Abstracts Views on Vision4Press platform.
Data correspond to usage on the plateform after 2015. The current usage metrics is available 48-96 hours after online publication and is updated daily on week days.
Initial download of the metrics may take a while.