Fig. 3.
Download original image
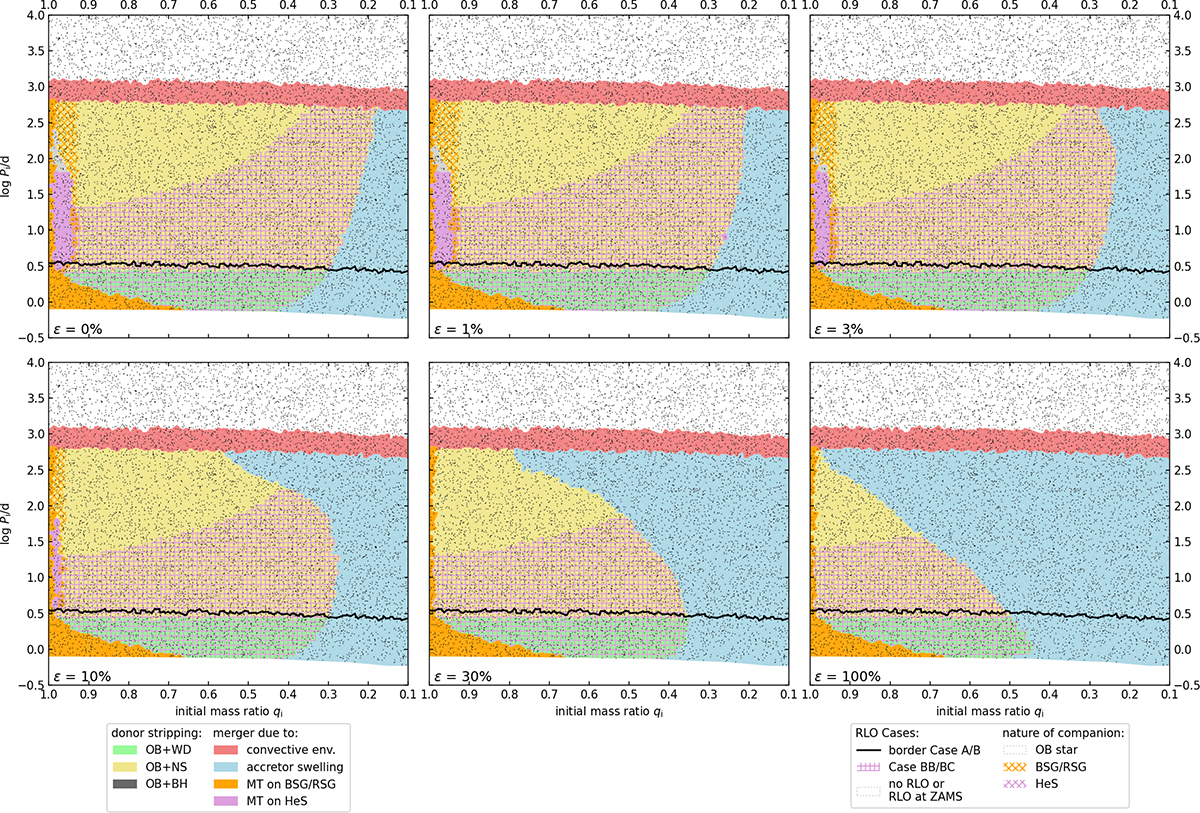
Evolutionary outcome of our binary models with a primary mass of 10 M⊙ at the time when the first SR has formed, or when the system merges, as a function of initial orbital period (Pi) and initial mass ratio (qi) for six different mass-transfer efficiencies (ε). Each black dot represents one model system, and their total number in each plot is 104. We coloured the plane according to the result of the closest model (Voronoi diagram). We mark the boundary between RLO Case A and B by a black line. The occurrence of a later RLO with a HeS donor (i.e. Case BB or BC) is indicated by pink hatches. If the companion to a SR is not a MS star but a post-MS star, we mark it by orange cross-hatches in case it is H-rich (BSG/RSG), or by pink cross-hatches if it is H-poor (HeS). White regions are those with no RLO (top) or RLO at ZAMS (bottom). In grey areas, the outcome is not none of the above (often two SNe immediately after each other due to the final temporal resolution).
Current usage metrics show cumulative count of Article Views (full-text article views including HTML views, PDF and ePub downloads, according to the available data) and Abstracts Views on Vision4Press platform.
Data correspond to usage on the plateform after 2015. The current usage metrics is available 48-96 hours after online publication and is updated daily on week days.
Initial download of the metrics may take a while.