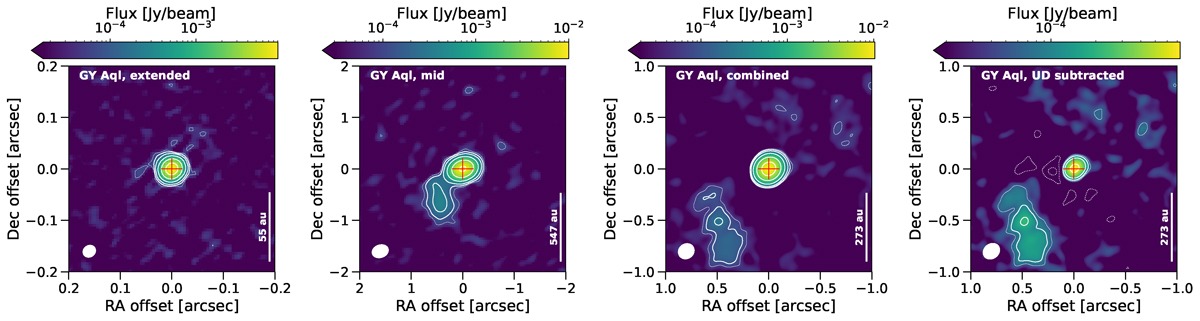
Fig. 1.
Download original image
Continuum maps of GY Aql taken with the extended (left), mid (centre left), and combined (centre right) array configurations of ALMA. The rightmost plot shows the residuals after subtracting a UD representing the AGB star (see text for details), highlighting extended dust features. The thin solid contours indicate levels of 3σ, the thick solid contours levels of 5, 10, 30, 100, and 300σ, and the dotted contours levels of −3 and −5σ. The continuum peak is indicated by the red cross, and the synthetic beam is given in the bottom-left corner of each image. The white bars on the lower right give indicative sizes in physical units for a third of the box length, based on the distance in Table 1. North is up and east to the left.
Current usage metrics show cumulative count of Article Views (full-text article views including HTML views, PDF and ePub downloads, according to the available data) and Abstracts Views on Vision4Press platform.
Data correspond to usage on the plateform after 2015. The current usage metrics is available 48-96 hours after online publication and is updated daily on week days.
Initial download of the metrics may take a while.