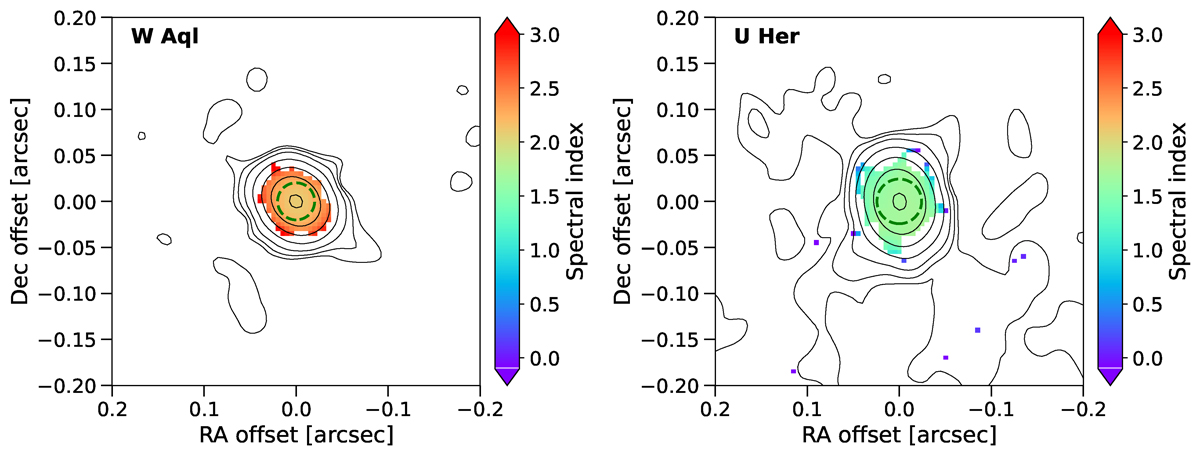
Fig. 19.
Download original image
Examples of spectral index determinations for W Aql (left) and U Her (right) computed from the combined Band 6 data. The spectral index (colours) is shown for the pixels where it is well-defined. The dashed green circle indicates the area, centred on the continuum peak, equal to the beam size convolved with the UD radius. Black contours indicate the combined continuum (see Figs. 4 and 8). Similar plots for the remaining ATOMIUM sources are given in Fig. B.5.
Current usage metrics show cumulative count of Article Views (full-text article views including HTML views, PDF and ePub downloads, according to the available data) and Abstracts Views on Vision4Press platform.
Data correspond to usage on the plateform after 2015. The current usage metrics is available 48-96 hours after online publication and is updated daily on week days.
Initial download of the metrics may take a while.