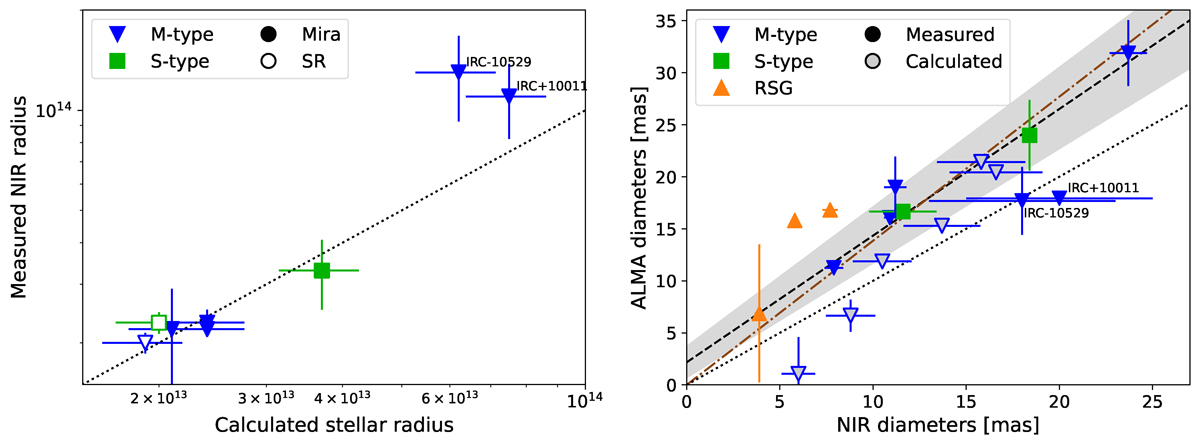
Fig. 20.
Download original image
Comparison between measured NIR and calculated stellar radii (left) and between the NIR and ALMA UD diameters (right). In each case, the dotted line represents a 1:1 relation. The dashed line in the right panel represents a fit to the measured AGB data points using orthogonal distance regression (Eq. (4)), with the grey region the uncertainty on this fit. The dot-dashed brown line shows the best linear fit for a relation forced to pass through the origin. See text for details. The shaded region in the right panel shows the uncertainty on the fit. The shaded region in the left panel shows that the measured NIR radii and the calculated radii for most stars fall within 15% of a 1:1 relation.
Current usage metrics show cumulative count of Article Views (full-text article views including HTML views, PDF and ePub downloads, according to the available data) and Abstracts Views on Vision4Press platform.
Data correspond to usage on the plateform after 2015. The current usage metrics is available 48-96 hours after online publication and is updated daily on week days.
Initial download of the metrics may take a while.