Open Access
Fig. 22.
Download original image
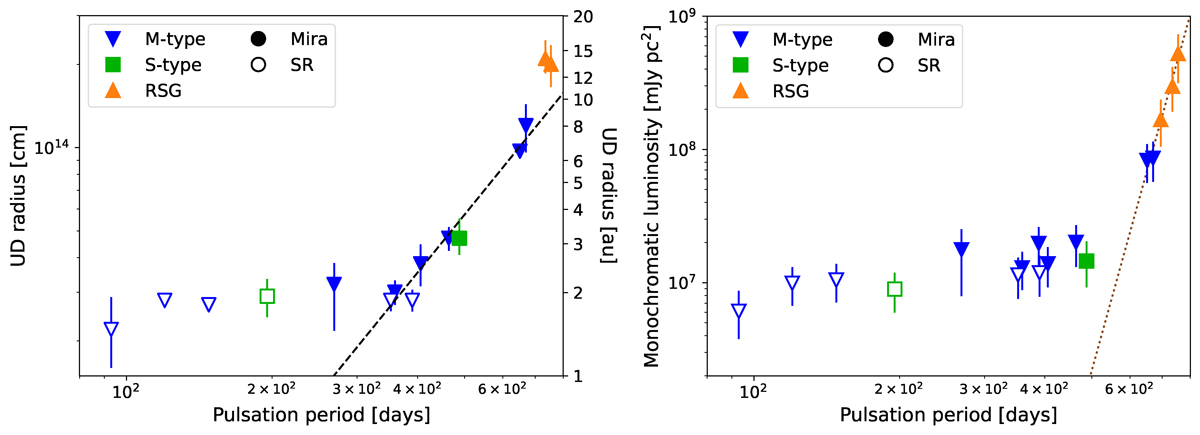
UD radii (left) and monochromatic fluxes (right) plotted against the pulsation period. The dashed black line in the left panel is a fit to the Mira variables. The dotted brown line in the right panel is a fit to the RSGs and the two Mira variables IRC−10529 and IRC+10011.
Current usage metrics show cumulative count of Article Views (full-text article views including HTML views, PDF and ePub downloads, according to the available data) and Abstracts Views on Vision4Press platform.
Data correspond to usage on the plateform after 2015. The current usage metrics is available 48-96 hours after online publication and is updated daily on week days.
Initial download of the metrics may take a while.