Open Access
Fig. 7.
Download original image
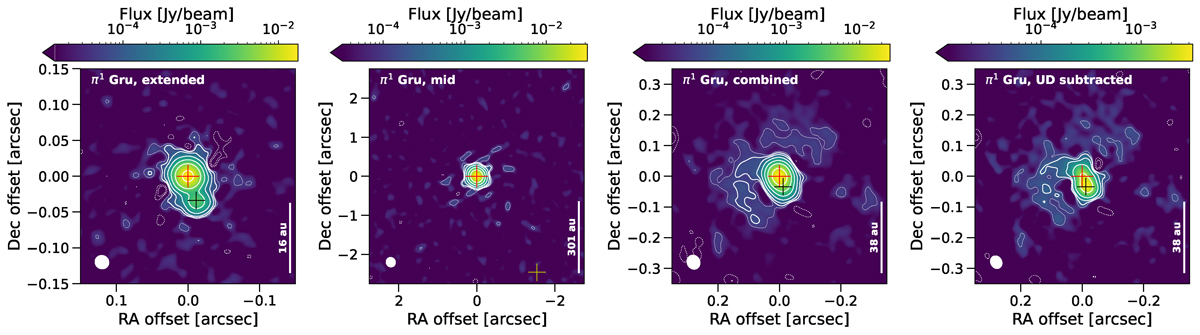
Similar to Fig. 1 but for π1 Gru. The centre of the secondary peak, corresponding to the C companion, is marked by the black cross on the extended, combined, and UD-subtracted plots. The yellow cross in the middle-left panel indicates the position of the B companion based on Gaia observations.
Current usage metrics show cumulative count of Article Views (full-text article views including HTML views, PDF and ePub downloads, according to the available data) and Abstracts Views on Vision4Press platform.
Data correspond to usage on the plateform after 2015. The current usage metrics is available 48-96 hours after online publication and is updated daily on week days.
Initial download of the metrics may take a while.