Open Access
Fig. 16
Download original image
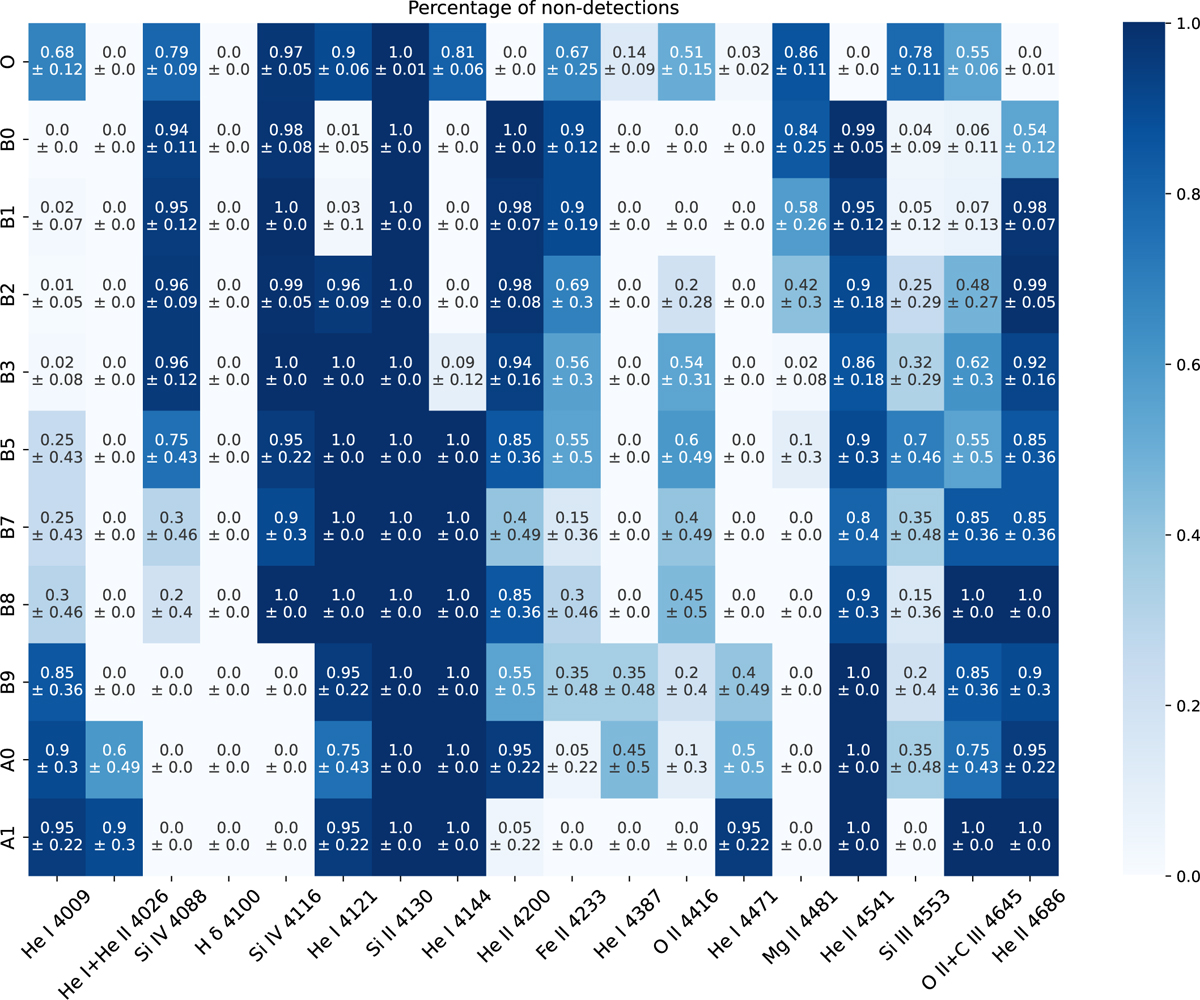
Percentage of undetected lines across different spectral types of massive standard stars. For each iteration, we used a random sample of S/N values from the distribution of S/Ns in LAMOST candidates. We present the mean detection rate and the standard deviation for 20 iterations.
Current usage metrics show cumulative count of Article Views (full-text article views including HTML views, PDF and ePub downloads, according to the available data) and Abstracts Views on Vision4Press platform.
Data correspond to usage on the plateform after 2015. The current usage metrics is available 48-96 hours after online publication and is updated daily on week days.
Initial download of the metrics may take a while.