Fig. 3.
Download original image
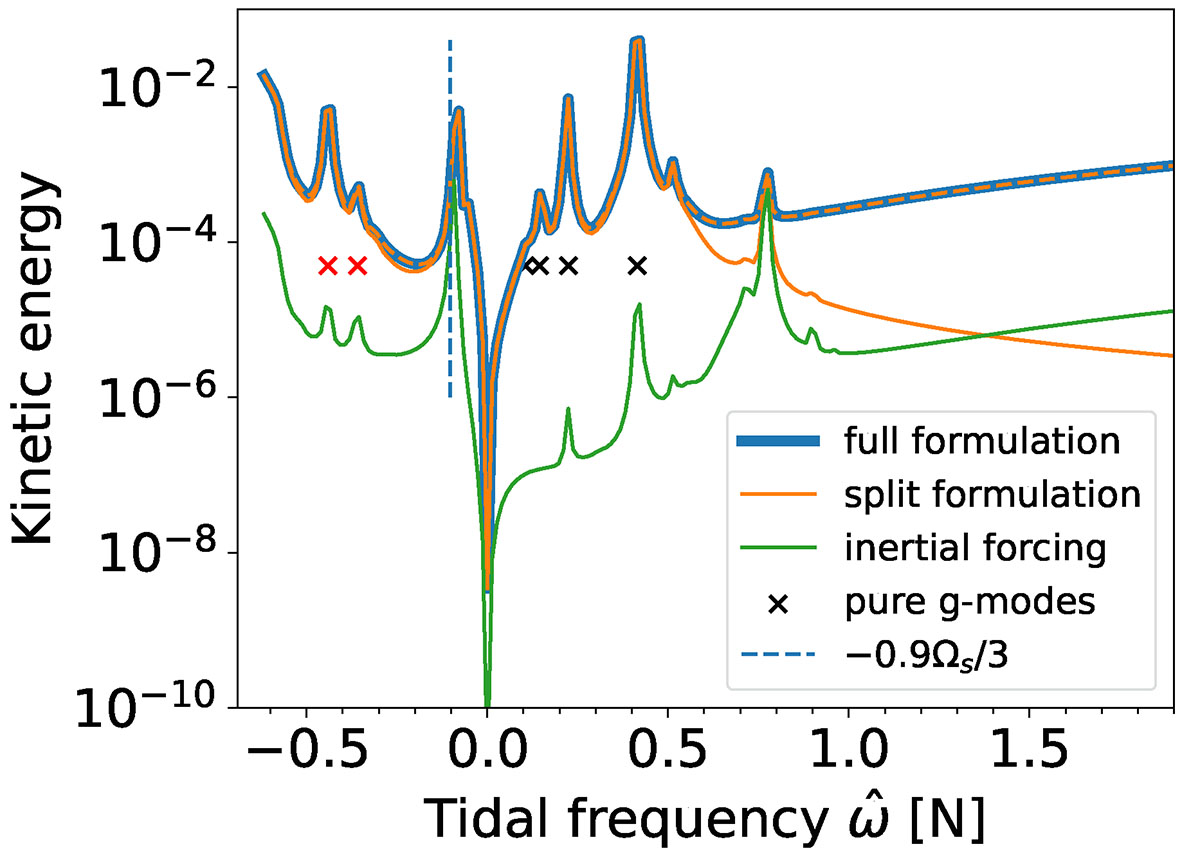
Kinetic energies of tidally excited fluid motions as functions of the tidal forcing frequency, ![]() , when the full tidal potential is taken into account (blue) and when the tidal forcing is effectively described using the equilibrium tidal flow (orange). The dashed orange line also corresponds to the split formulation but with different boundary conditions (see text), while the solid green line corresponds to the modes obtained only with the effective tidal forcing, ft, due to Coriolis force. Pure g-modes frequencies (black, Eq. (33)) and negative g-modes (red) are designated by a cross. A Rossby mode resonance is highlighted at
, when the full tidal potential is taken into account (blue) and when the tidal forcing is effectively described using the equilibrium tidal flow (orange). The dashed orange line also corresponds to the split formulation but with different boundary conditions (see text), while the solid green line corresponds to the modes obtained only with the effective tidal forcing, ft, due to Coriolis force. Pure g-modes frequencies (black, Eq. (33)) and negative g-modes (red) are designated by a cross. A Rossby mode resonance is highlighted at ![]() .
.
Current usage metrics show cumulative count of Article Views (full-text article views including HTML views, PDF and ePub downloads, according to the available data) and Abstracts Views on Vision4Press platform.
Data correspond to usage on the plateform after 2015. The current usage metrics is available 48-96 hours after online publication and is updated daily on week days.
Initial download of the metrics may take a while.