Open Access
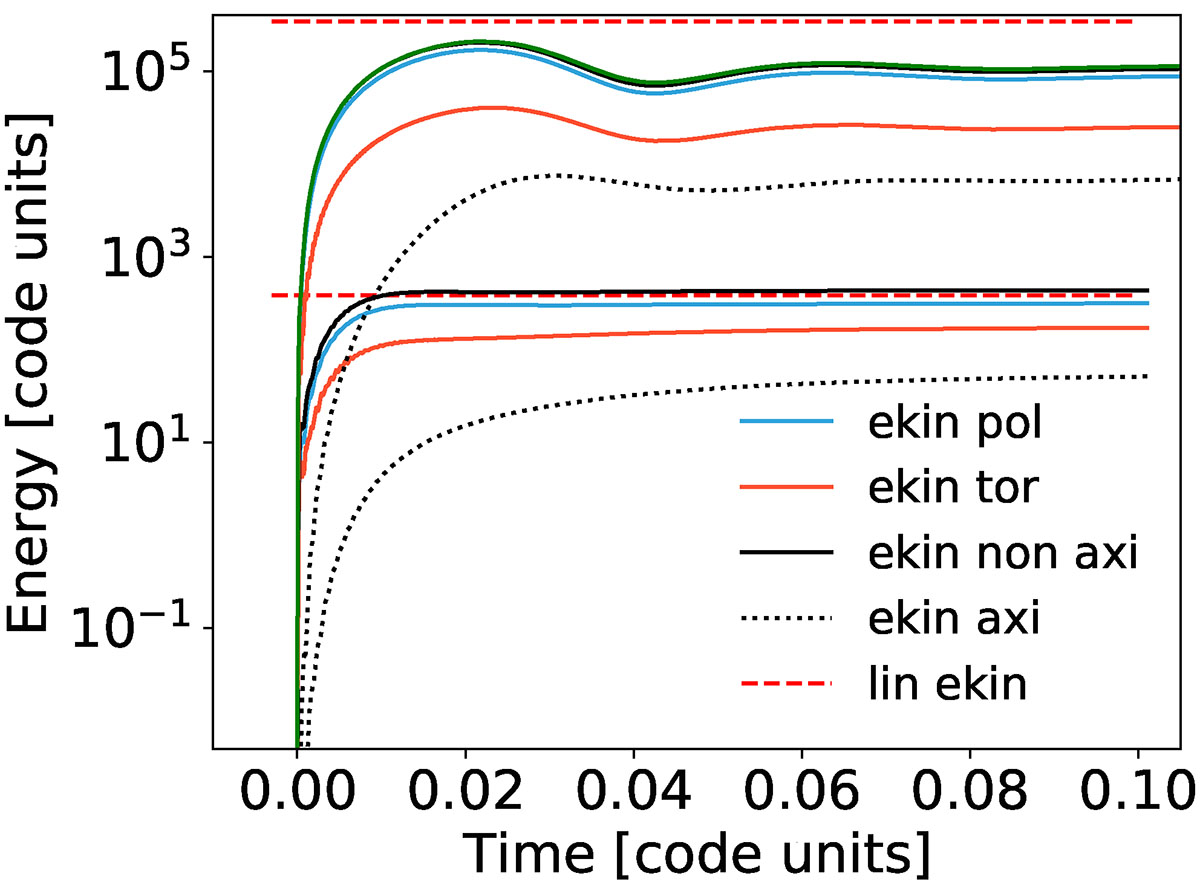
Fig. 9.
Download original image
Time evolution of the kinetic energy for the nonlinear simulations of 1g and 2g modes compared to the linear results (dashed red lines). The lines above correspond to the 1g mode with ![]() . The lines below correspond to the 2g− mode with
. The lines below correspond to the 2g− mode with ![]() , which are rescaled by a factor of 0.1 for improved visibility.
, which are rescaled by a factor of 0.1 for improved visibility.
Current usage metrics show cumulative count of Article Views (full-text article views including HTML views, PDF and ePub downloads, according to the available data) and Abstracts Views on Vision4Press platform.
Data correspond to usage on the plateform after 2015. The current usage metrics is available 48-96 hours after online publication and is updated daily on week days.
Initial download of the metrics may take a while.