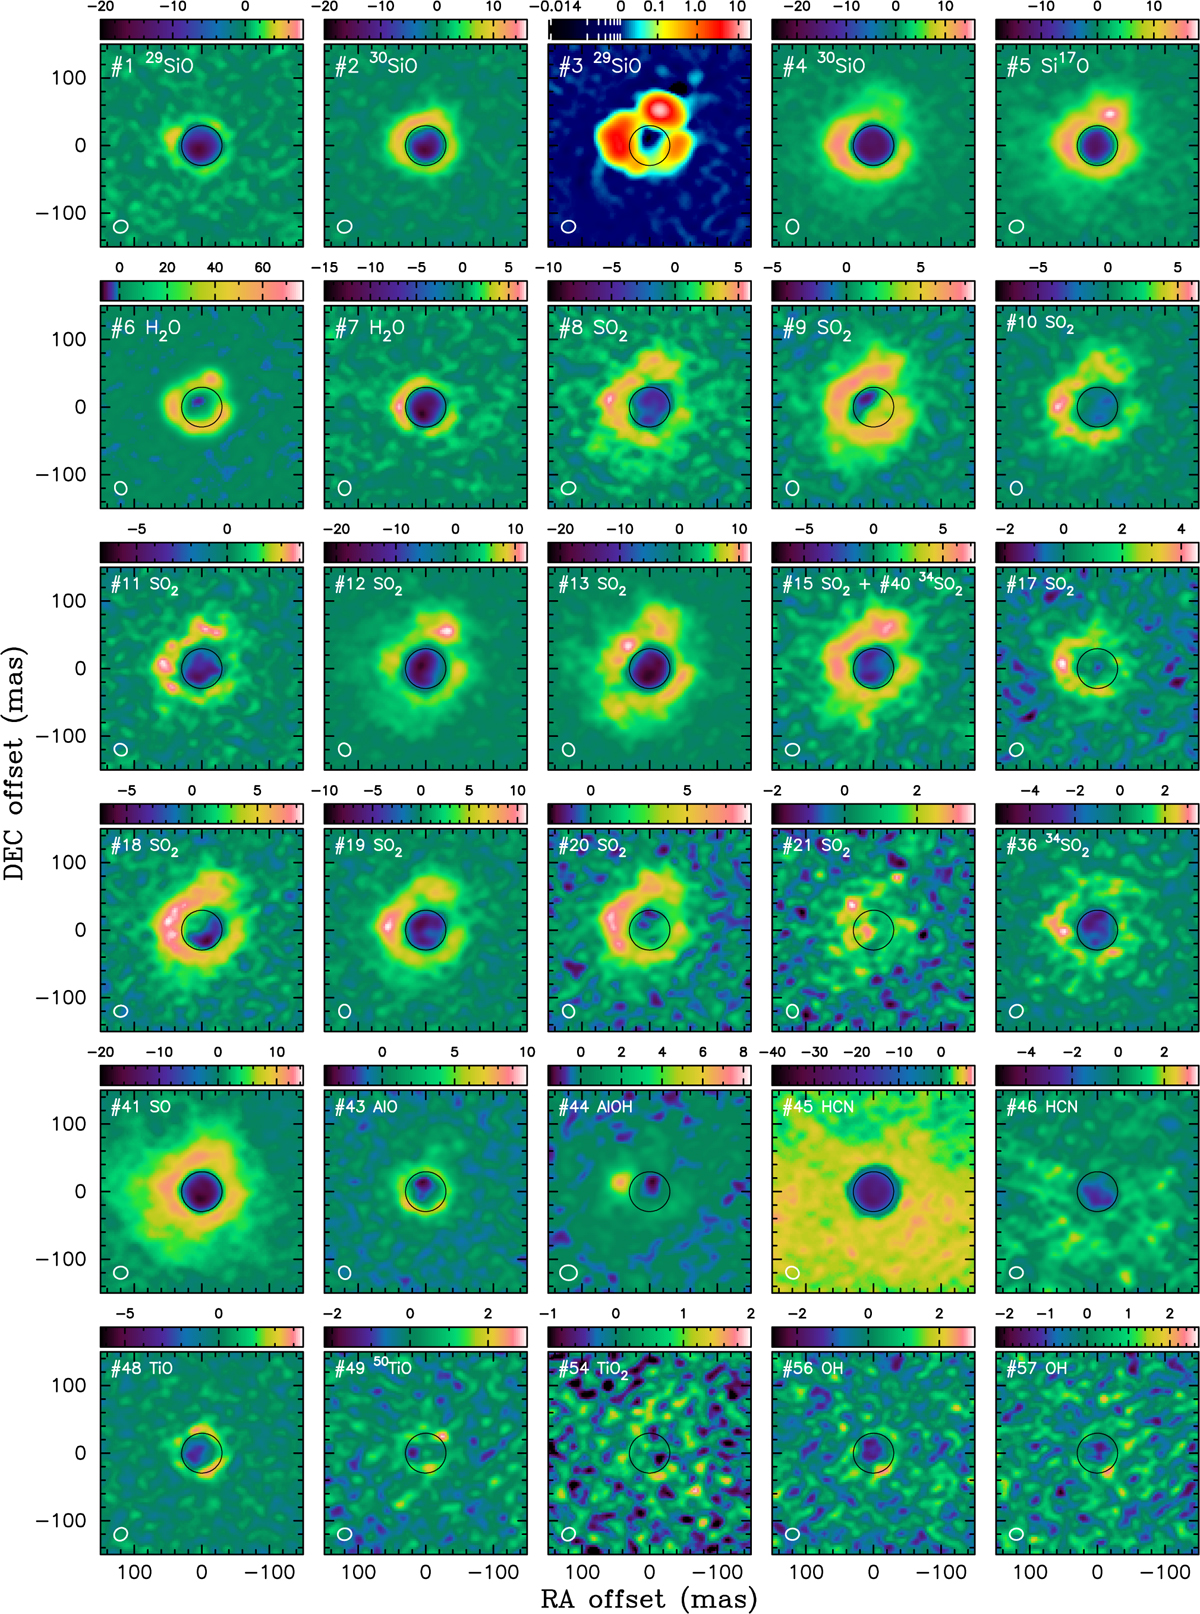
Fig. 1
Download original image
Continuum-subtracted maps of W Hya observed at the systemic velocity in the different molecular lines presented in the main text. The images of two H2O lines (#6 and #7) are from Paper I. The color scale shown above each panel corresponds to mJy/beam except for #3, where it is given in Jy/beam. The black circles represent the ellipse fit to the continuum image. The identification number of each line in Table 2 is shown in the upper left corner. The restoring beam size is shown in the lower left corner of each panel. North is up, and east is to the left.
Current usage metrics show cumulative count of Article Views (full-text article views including HTML views, PDF and ePub downloads, according to the available data) and Abstracts Views on Vision4Press platform.
Data correspond to usage on the plateform after 2015. The current usage metrics is available 48-96 hours after online publication and is updated daily on week days.
Initial download of the metrics may take a while.