Fig. 13
Download original image
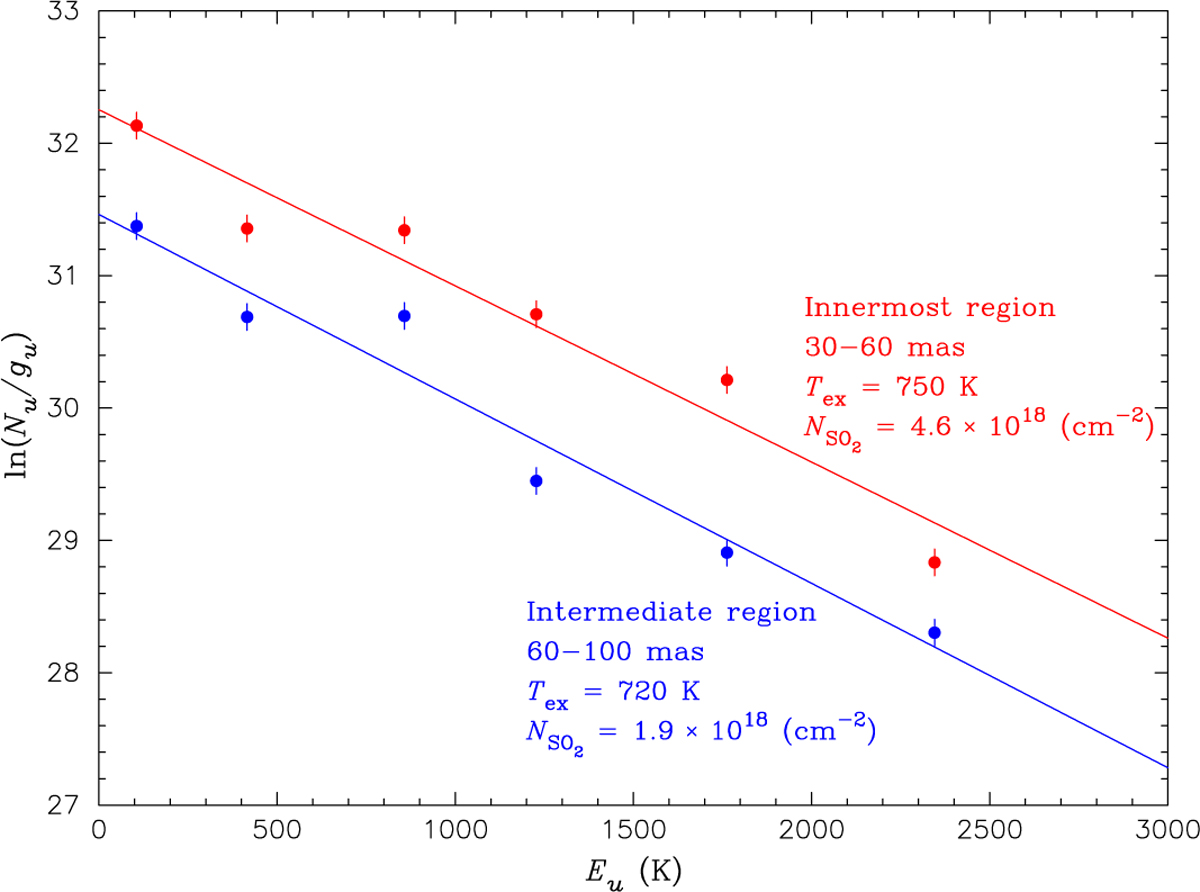
Population diagram for the SO2 lines without signatures of nonthermal emission in the innermost and intermediate regions defined as annular areas between 30 and 60 mas (~1 and 2 Rcont) and between 60 and 100 mas (~2 and 3.3 Rcont), respectively. The red and blue dots represent the measurements in the innermost and intermediate regions, respectively. The solid red and blue lines represent the fits in the respective regions. The excitation temperatures (Tex) and column densities (NSO2) derived in two regions are also shown.
Current usage metrics show cumulative count of Article Views (full-text article views including HTML views, PDF and ePub downloads, according to the available data) and Abstracts Views on Vision4Press platform.
Data correspond to usage on the plateform after 2015. The current usage metrics is available 48-96 hours after online publication and is updated daily on week days.
Initial download of the metrics may take a while.