Fig. 16
Download original image
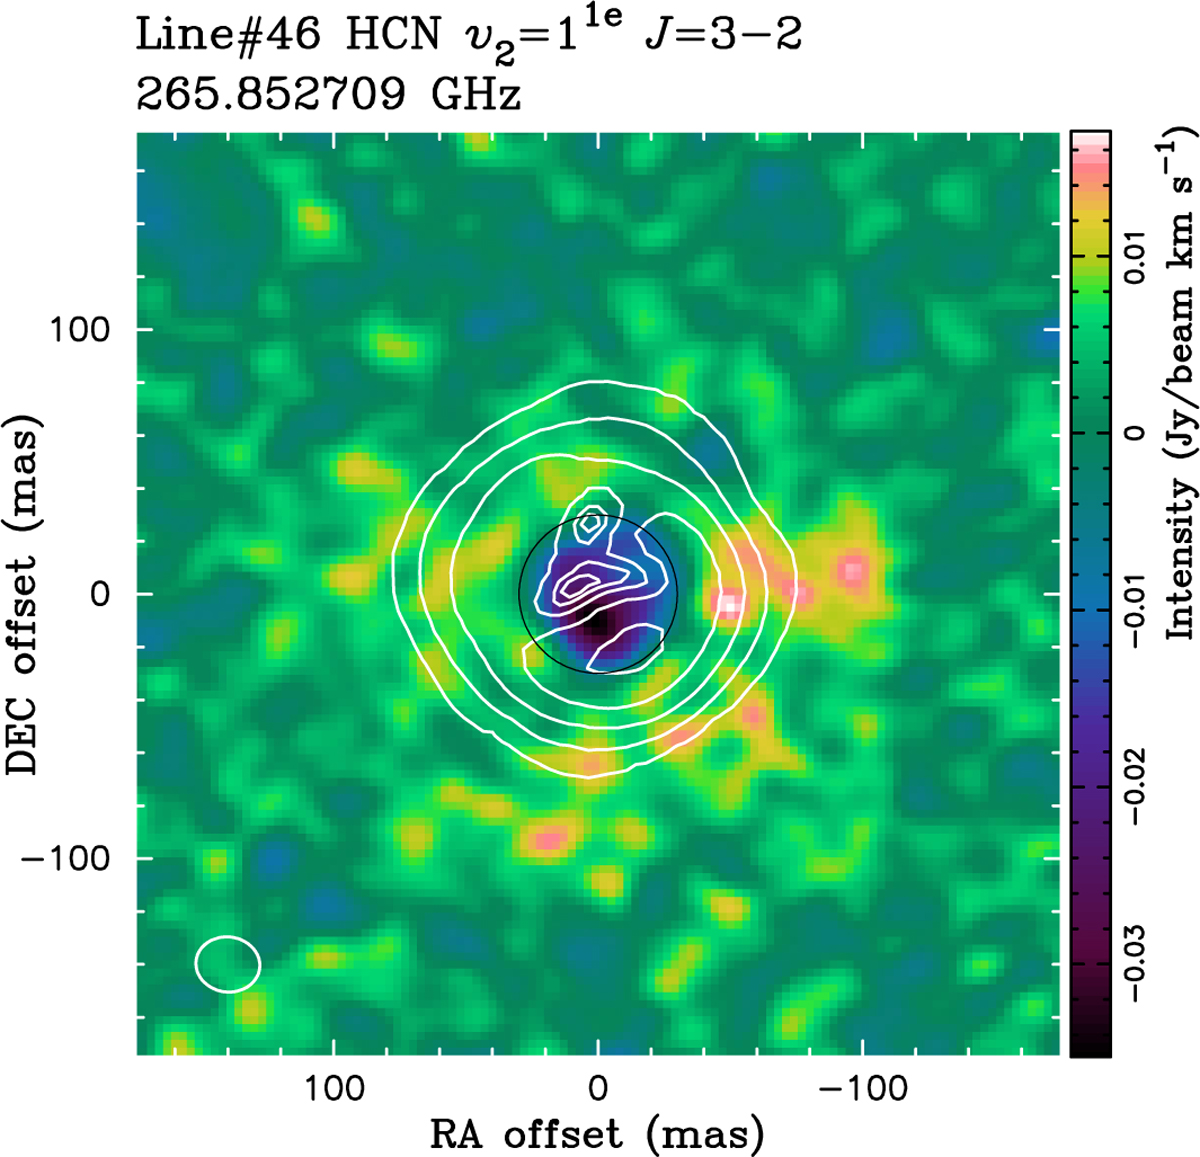
Color map: intensity map of the HCN (v2 = 11e, J = 3–2) line at 265.852709 GHz integrated from Vrel = −10.5 to 10.5 km s−1. Contours: polarized intensity obtained at 820 nm contemporaneously with our ALMA observations (Paper I). The contours are drawn on a logarithmic scale at 10%, 17%, 30%, 52%, and 90% of the peak value. The black circle represents the millimeter continuum stellar disk. The beam size of the HCN intensity map is shown in the lower left corner.
Current usage metrics show cumulative count of Article Views (full-text article views including HTML views, PDF and ePub downloads, according to the available data) and Abstracts Views on Vision4Press platform.
Data correspond to usage on the plateform after 2015. The current usage metrics is available 48-96 hours after online publication and is updated daily on week days.
Initial download of the metrics may take a while.