Fig. 18
Download original image
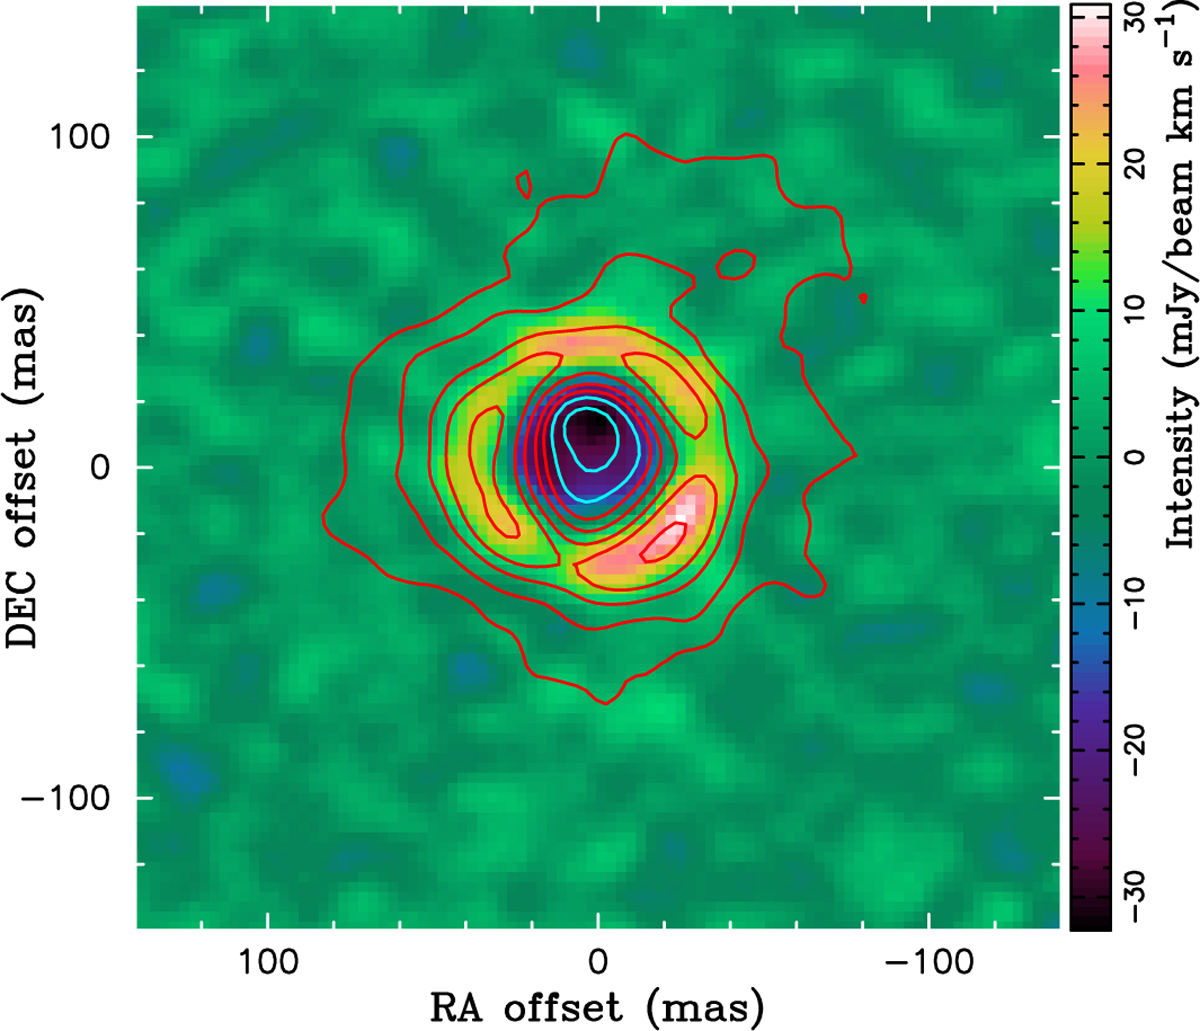
Comparison of the continuum-subtracted integrated intensity maps of the lines of TiO (v = 1, 3Δ1, J = 8–7) and AlO (N = 7–6). The color map and contours represent the TiO and AlO lines, respectively. The TiO intensity map was obtained by integrating from Vrel = −10 to 6 km s−1, avoiding the AlOH line. The red and light blue contours correspond to the same positive and negative intensity levels, respectively, as shown in Fig. 17.
Current usage metrics show cumulative count of Article Views (full-text article views including HTML views, PDF and ePub downloads, according to the available data) and Abstracts Views on Vision4Press platform.
Data correspond to usage on the plateform after 2015. The current usage metrics is available 48-96 hours after online publication and is updated daily on week days.
Initial download of the metrics may take a while.