Fig. 19
Download original image
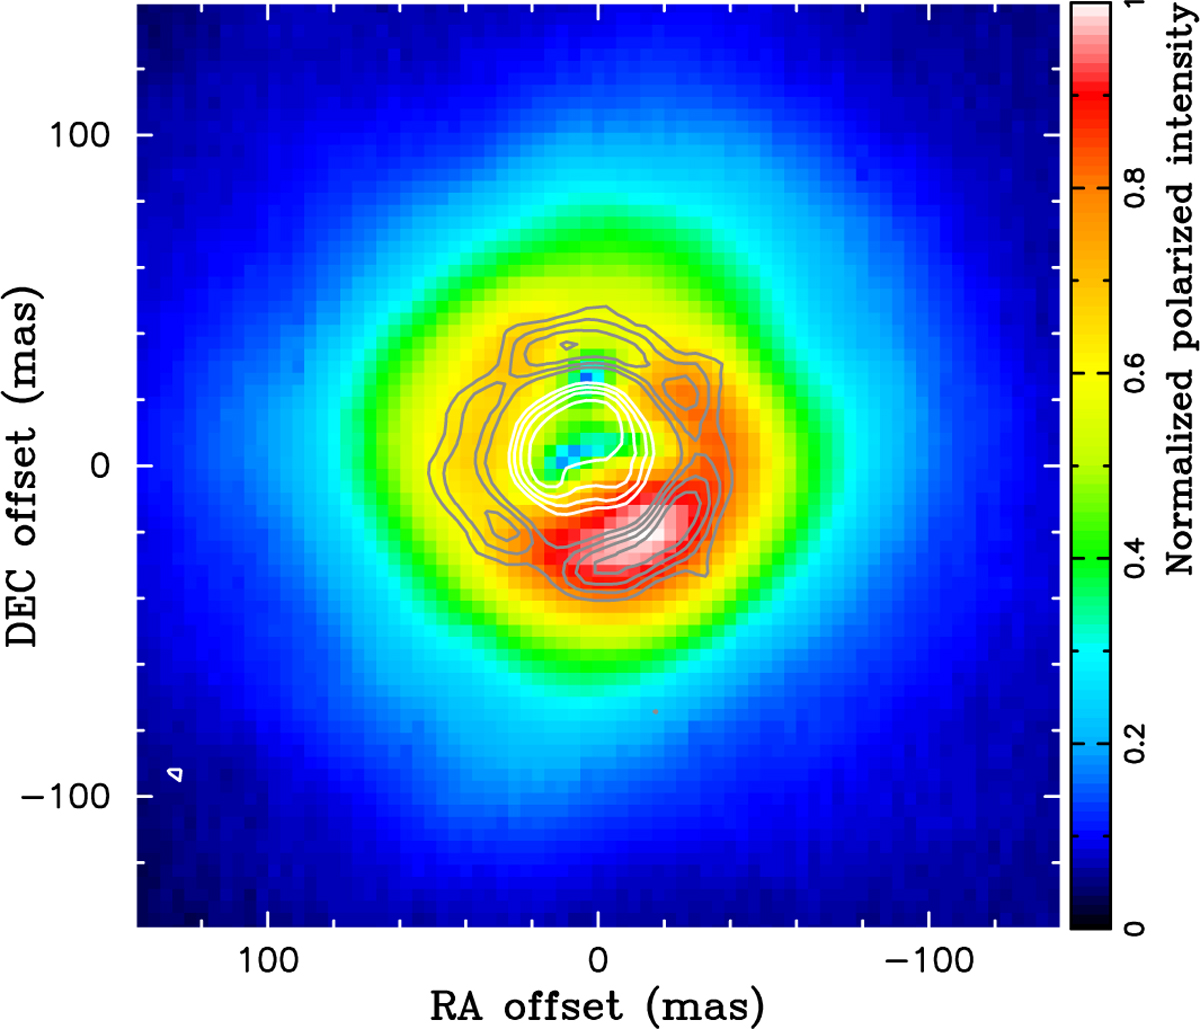
Comparison of the continuum-subtracted integrated intensity maps of the vibrationally excited TiO line (v = 1, 3Δ1, J = 8–7) and the polarized intensity map obtained at 820 nm. The color map and contours represent the polarized intensity and the TiO line, respectively. The gray and white contours correspond to positive values (0.01, 0.015, 0.02, and 0.025 mJy/beam km s−1) and negative values (−0.025, −0.02, −0.015, and −0.01 mJy/beam km s−1), respectively.
Current usage metrics show cumulative count of Article Views (full-text article views including HTML views, PDF and ePub downloads, according to the available data) and Abstracts Views on Vision4Press platform.
Data correspond to usage on the plateform after 2015. The current usage metrics is available 48-96 hours after online publication and is updated daily on week days.
Initial download of the metrics may take a while.