Open Access
Fig. 2
Download original image
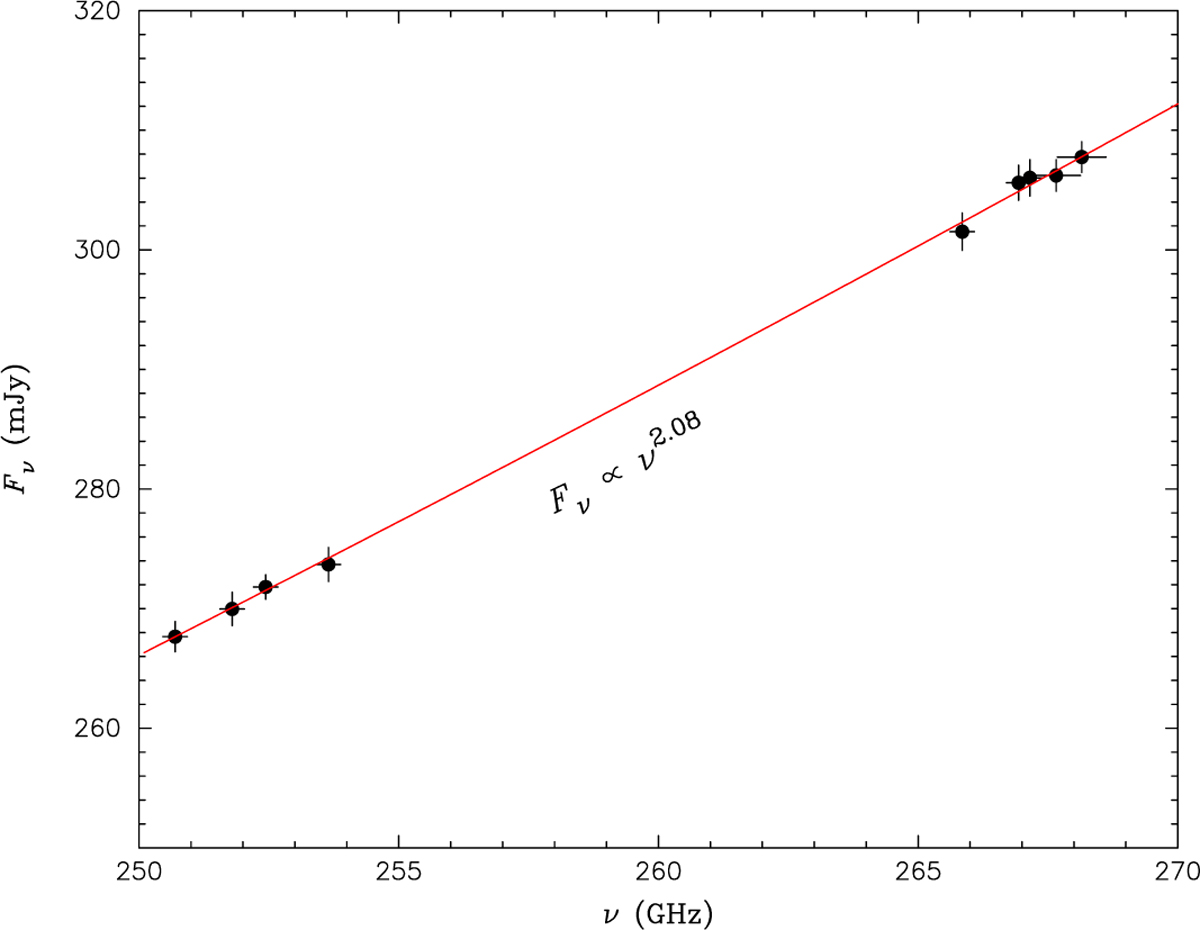
Continuum spectrum of W Hya at 250–268 GHz. The black dots represent the observed continuum fluxes, while the solid red line represents a power-law fit with Fv ∝ v2.08. The horizontal bars show the bandwidth of the spectral windows, not errors.
Current usage metrics show cumulative count of Article Views (full-text article views including HTML views, PDF and ePub downloads, according to the available data) and Abstracts Views on Vision4Press platform.
Data correspond to usage on the plateform after 2015. The current usage metrics is available 48-96 hours after online publication and is updated daily on week days.
Initial download of the metrics may take a while.