Fig. 4
Download original image
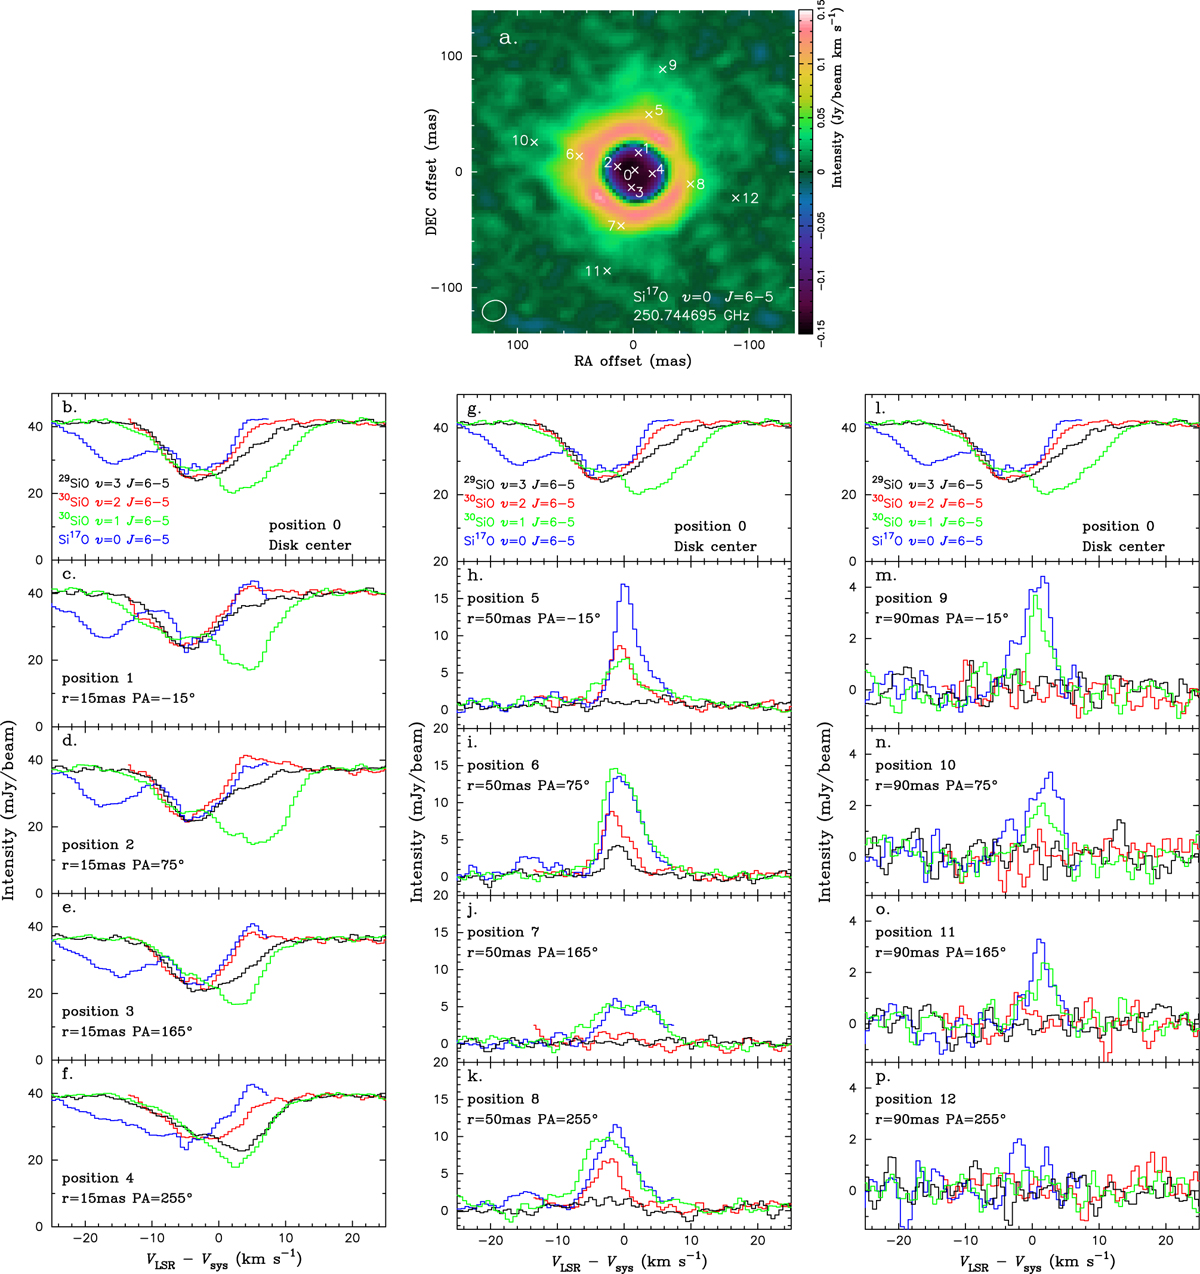
Spatially resolved spectra of four SiO lines detected in our ALMA observations. (a) Continuum-subtracted intensity map of the Si 17O line (v = 0, J = 6–5) integrated from Vrel = −10 to 10 km s−1. The crosses and numbers represent the positions where the spatially resolved spectra shown in panels b–p were derived. (b–f) Spatially resolved spectra observed at five positions over the stellar disk. The black, red, green, and blue lines represent the spectra of the 29SiO v = 3 J = 6–5, 30SiO v = 2 J = 6–5, 30SiO v = 1 J = 6–5, and Si17O v = 0 J = 6–5 lines, respectively. The spectra were obtained from the data cube with the continuum emission. (g–k) SiO spectra obtained at positions 5–8 at a radial distance of 50 mas from the stellar disk center. These spectra were extracted from the continuum-subtracted data cube. The spectra measured at the disk center are shown in panel g to facilitate comparison between the absorption and emission spectra. (l–p) SiO spectra obtained at positions 9–12 at a radial distance of 90 mas from the stellar disk center, shown in the same manner as in panels g–k.
Current usage metrics show cumulative count of Article Views (full-text article views including HTML views, PDF and ePub downloads, according to the available data) and Abstracts Views on Vision4Press platform.
Data correspond to usage on the plateform after 2015. The current usage metrics is available 48-96 hours after online publication and is updated daily on week days.
Initial download of the metrics may take a while.