Fig. 7
Download original image
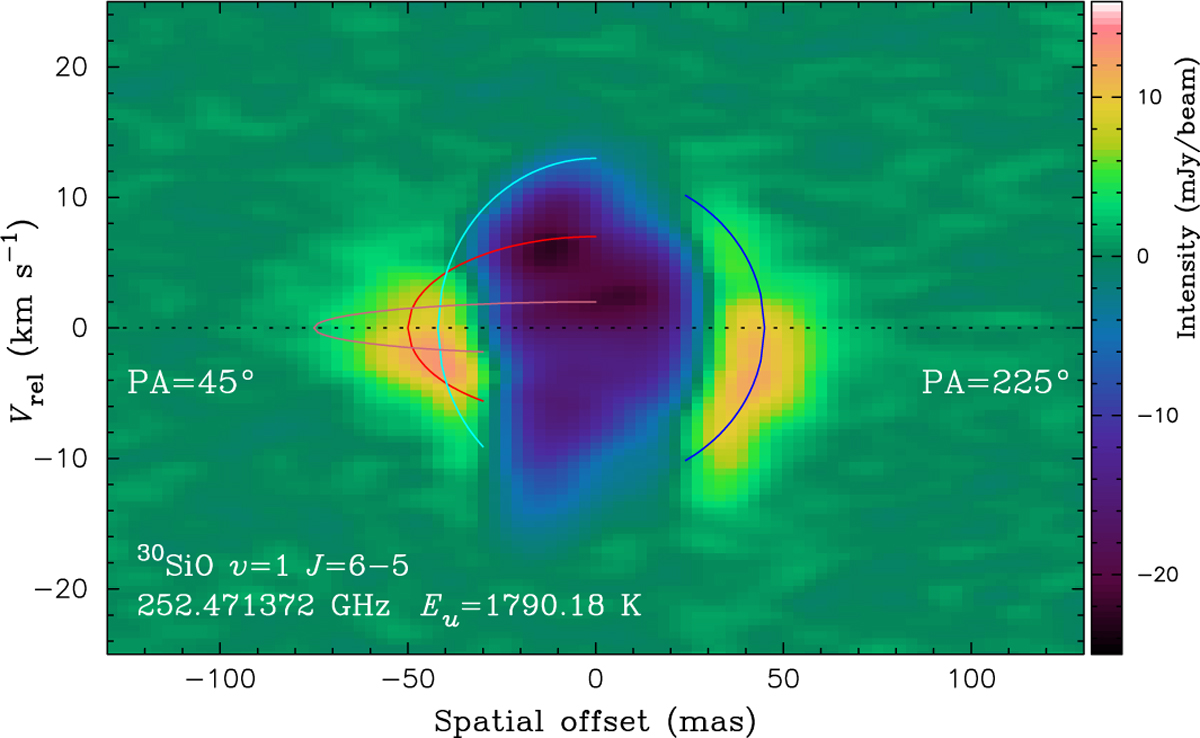
Position-velocity diagram in the direction from PA = 45° to 225° obtained from the continuum-subtracted channel maps of the 30SiO line (v = 1, J = 6–5). The pink, red, and light blue curves at the negative spatial offsets (on the side of PA = 45°) represent the traces expected from shells infalling at velocities of 2 km s−1 at a radius of 75 mas, 7 km s−1 at 50 mas, and 13 km s−1 at 42 mas, respectively. The blue curve on the PA = 225° side shows the trace from an infalling or outflowing (although infalling is more plausible) shell with a velocity of 12 km s−1 at a radius of 45 mas. See Sect. 4.4.
Current usage metrics show cumulative count of Article Views (full-text article views including HTML views, PDF and ePub downloads, according to the available data) and Abstracts Views on Vision4Press platform.
Data correspond to usage on the plateform after 2015. The current usage metrics is available 48-96 hours after online publication and is updated daily on week days.
Initial download of the metrics may take a while.