Fig. 8
Download original image
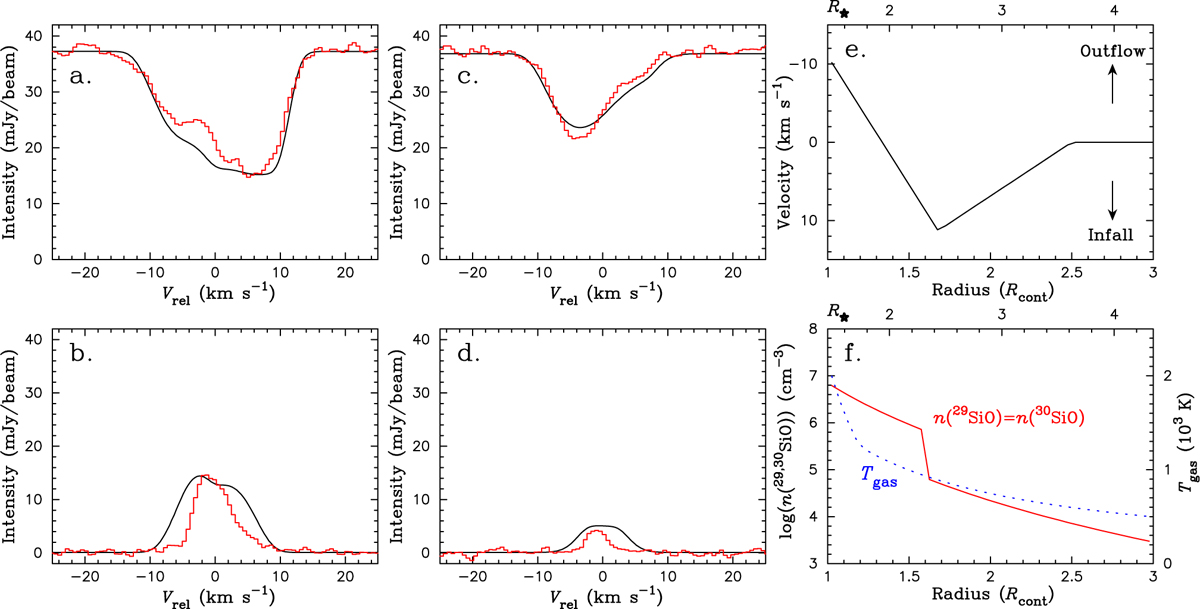
Spherical LTE model for the 30SiO v = 1 J = 6–5 and 29SiO v = 3 J = 6–5 lines. Panels a and b show a comparison between the model (black) and the spectra of the 30SiO v = 1 line (red) observed over the stellar disk and off the limb of the disk (positions 2 and 6 in Fig. 4), respectively. Panels c and d show a comparison for the 29SiO v = 3 line in the same manner. The velocity profile of the model is shown in panel e. Positive and negative velocities correspond to infall and outflow, respectively. Panel f shows the 29SiO number density (assumed to be equal to that of 30SiO) on the left ordinate and the gas temperature on the right ordinate. In panels e and f, the radius is shown in the units of Rcont (below) and R⋆ (above).
Current usage metrics show cumulative count of Article Views (full-text article views including HTML views, PDF and ePub downloads, according to the available data) and Abstracts Views on Vision4Press platform.
Data correspond to usage on the plateform after 2015. The current usage metrics is available 48-96 hours after online publication and is updated daily on week days.
Initial download of the metrics may take a while.