Open Access
Fig. 1.
Download original image
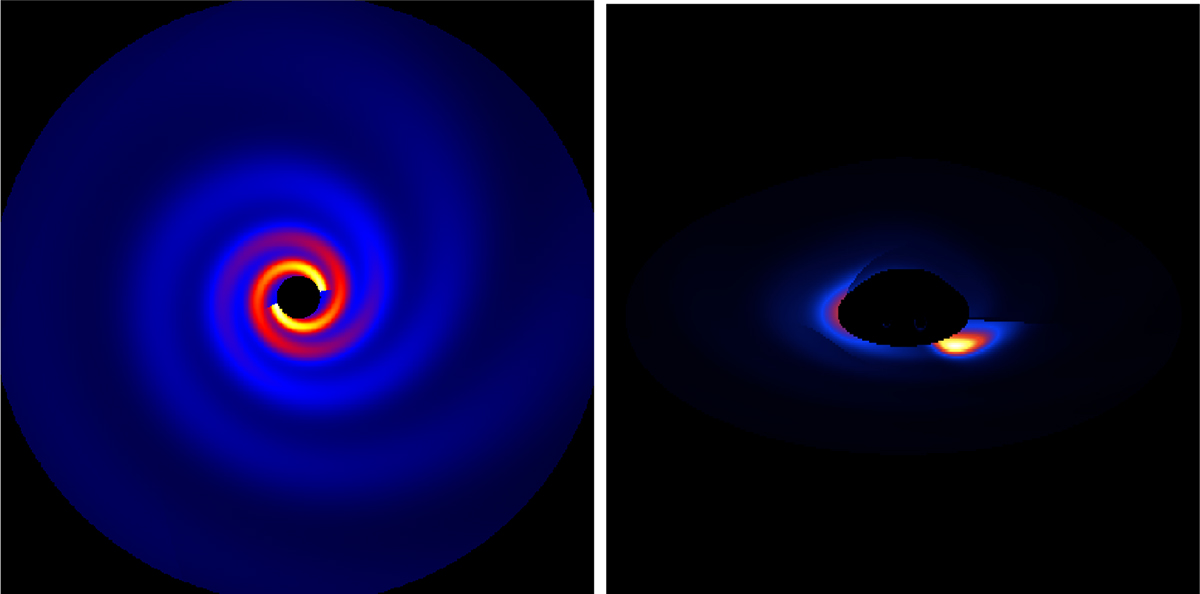
Emission maps with the {disk + spiral} temperature distribution computed at inclination i = 20° (left panel; γs = 0.5) and the {disk + lump} temperature distribution computed at inclination i = 70° (right panel; γl = 0.3). The value of γs is higher than in the remainder of the paper. It was chosen to enhance visibility.
Current usage metrics show cumulative count of Article Views (full-text article views including HTML views, PDF and ePub downloads, according to the available data) and Abstracts Views on Vision4Press platform.
Data correspond to usage on the plateform after 2015. The current usage metrics is available 48-96 hours after online publication and is updated daily on week days.
Initial download of the metrics may take a while.