Fig. 7.
Download original image
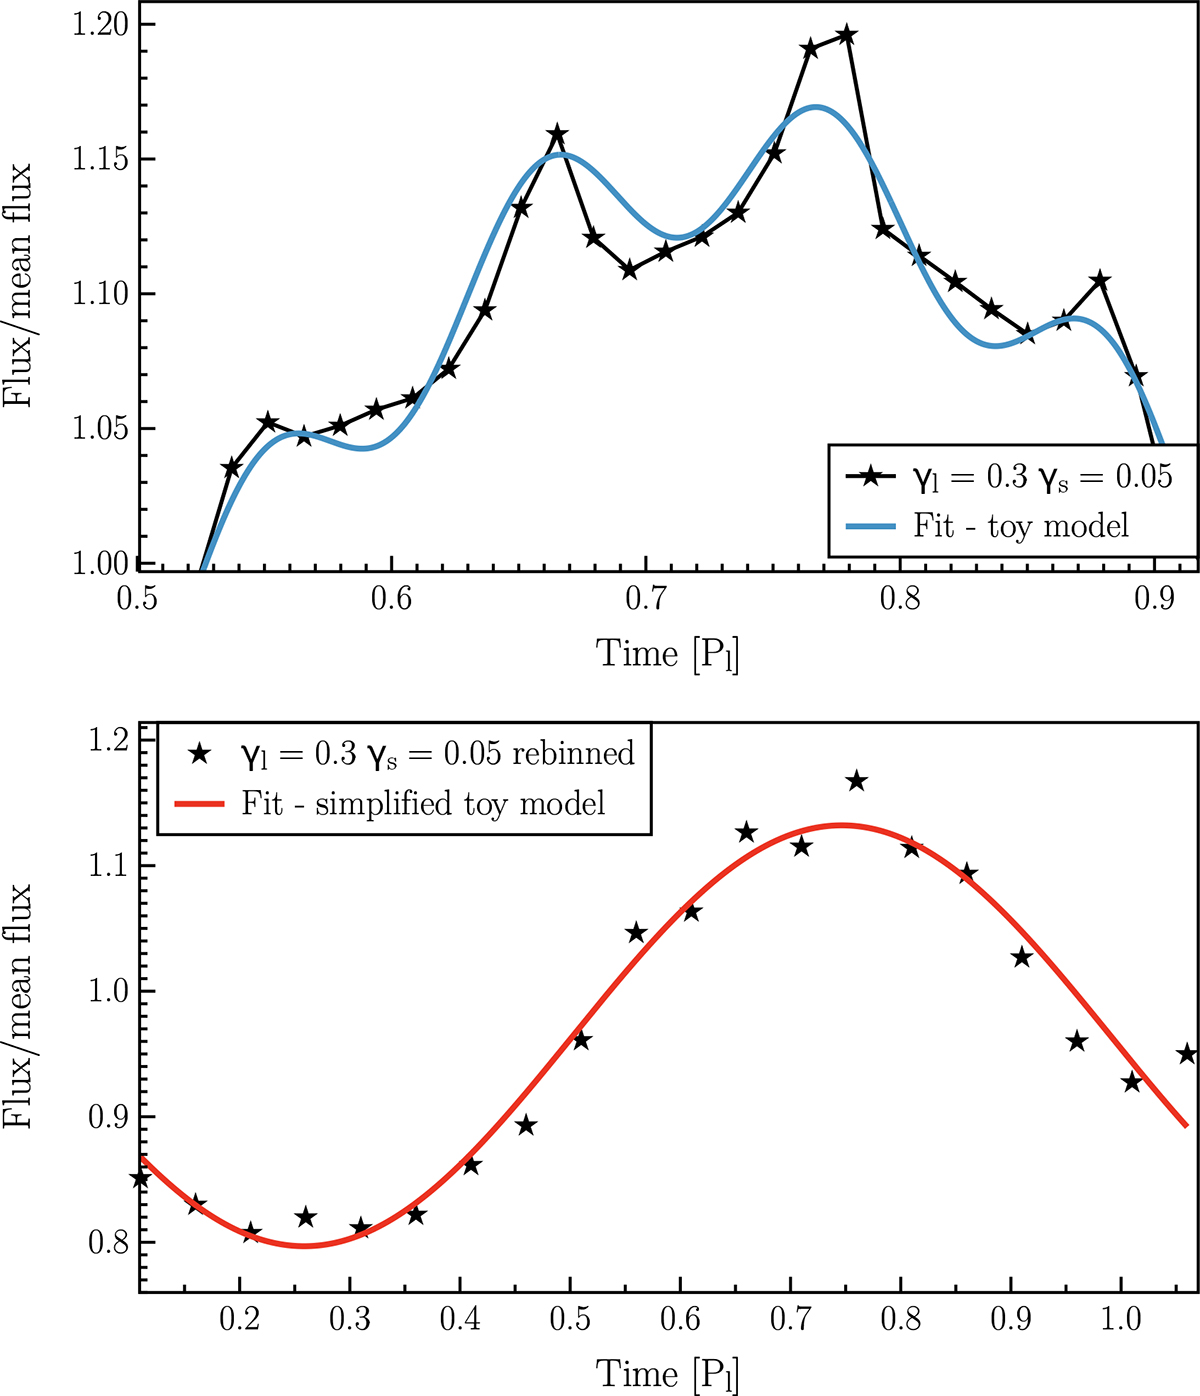
Top panel: bolometric flux from our temperature model, normalized by the average between the minimum and maximum values, as a function of time (black curve and stars) and its fit by the toy model function (Eq. (6), blue curve). Bottom panel: rebinned normalized LC (stars) and its fit by the simplified toy model function (Eq. (9), red curve). The model parameters are fixed to γl = 0.3, γs = 0.05, b = 20 M, and i = 70°.
Current usage metrics show cumulative count of Article Views (full-text article views including HTML views, PDF and ePub downloads, according to the available data) and Abstracts Views on Vision4Press platform.
Data correspond to usage on the plateform after 2015. The current usage metrics is available 48-96 hours after online publication and is updated daily on week days.
Initial download of the metrics may take a while.