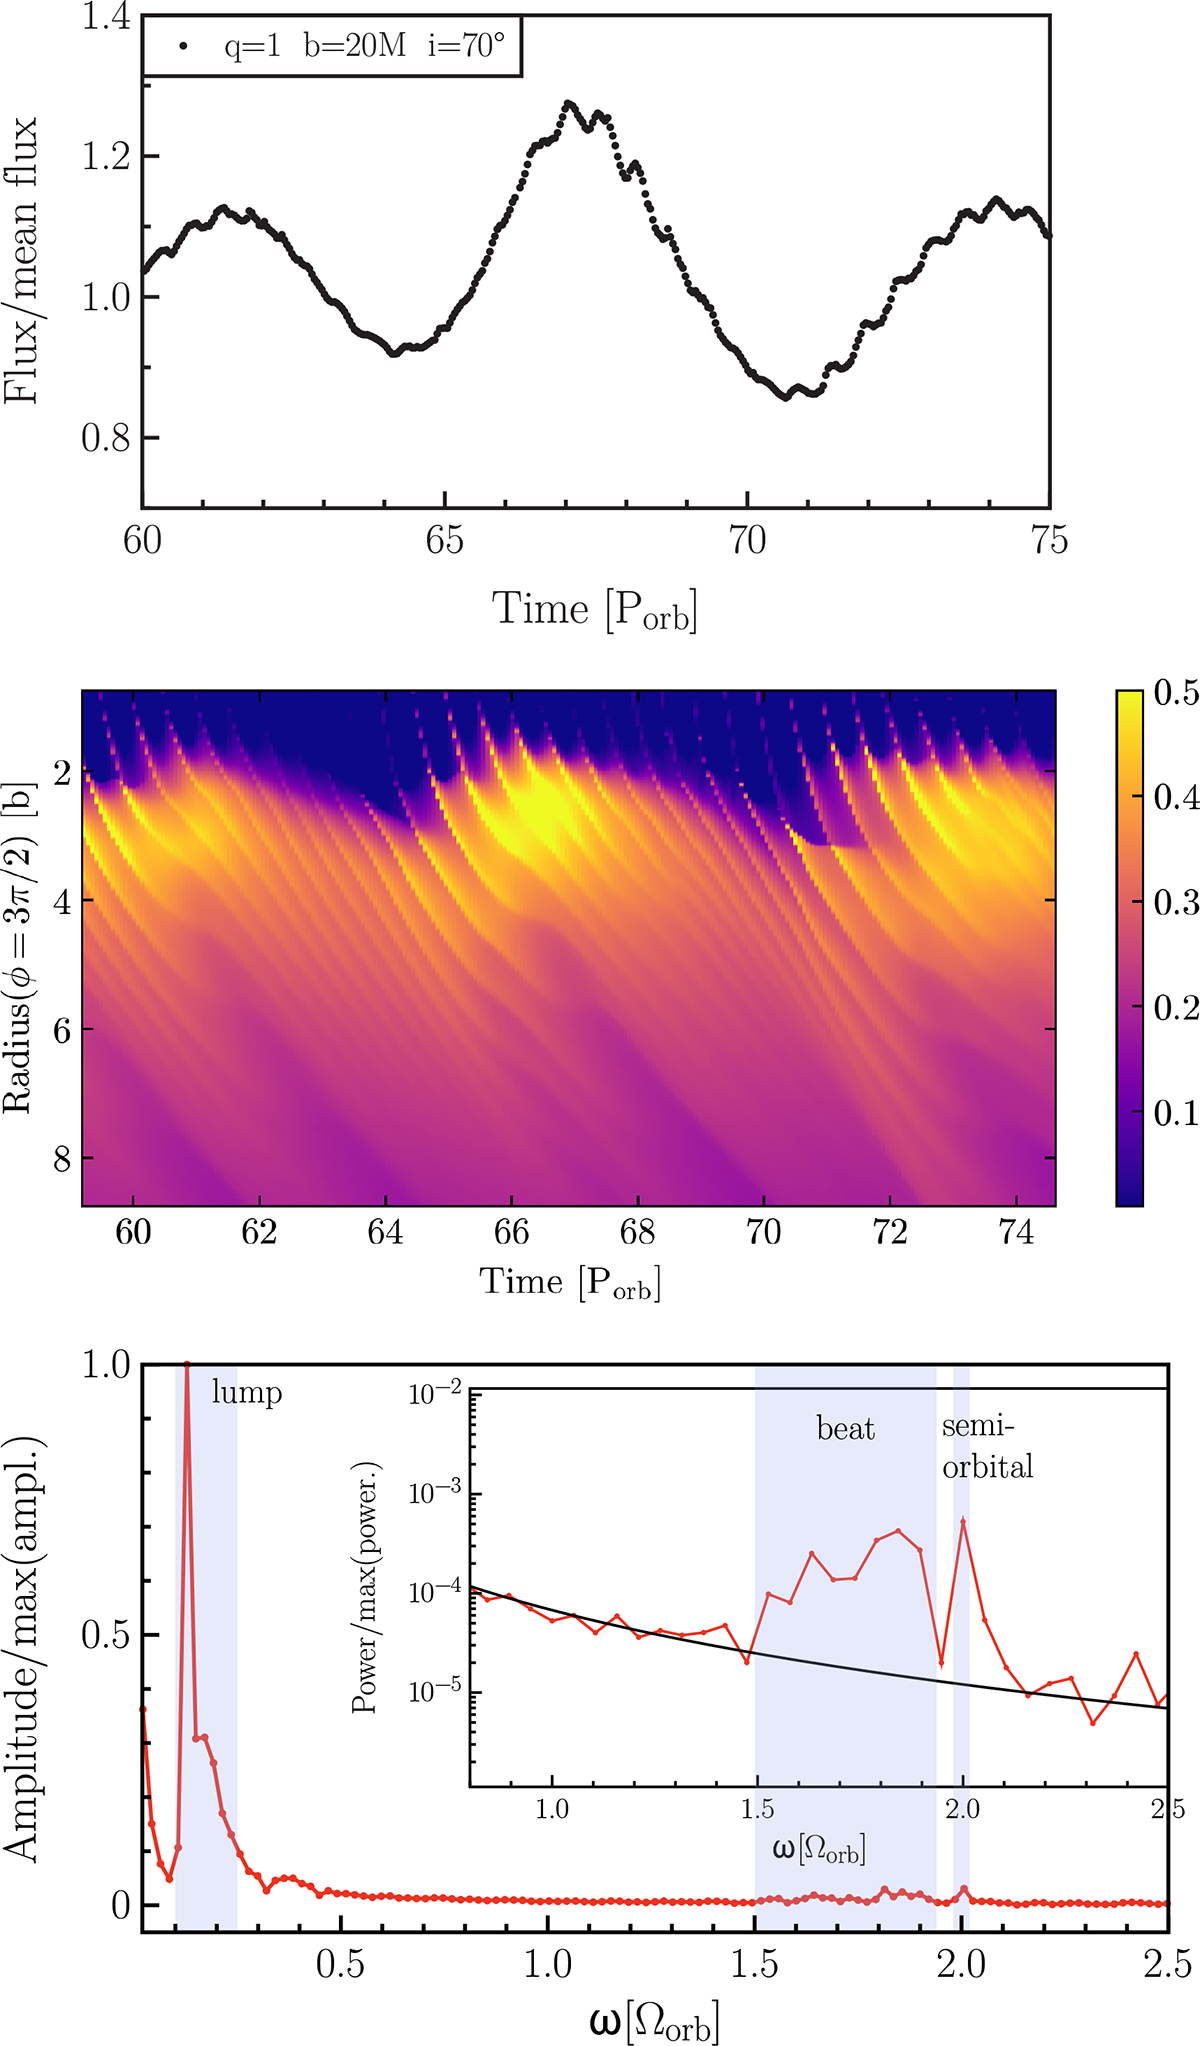
Fig. 8.
Download original image
Top panel: Normalized LC for q = 1, b = 20 M, seen at an inclination angle i = 70°. Two modulations dominate the LC, at the semi-orbital period and at the lump period. Middle panel: Density map in the (t, r)-plane for φ = 3π/2 (φ = 0 being the line of sight, it maximizes the Doppler effect) over the same period. Bottom panel: Amplitude of the Fourier modes in the LC, dominated by the lump modulation, and zoom-in view on the binary-lump beat signal, divided over a frequency interval, and the semi-orbital modulation. They are shown in power for clarity and are compared to a background red-noise fit of the form ω−α with α ∼ 2.
Current usage metrics show cumulative count of Article Views (full-text article views including HTML views, PDF and ePub downloads, according to the available data) and Abstracts Views on Vision4Press platform.
Data correspond to usage on the plateform after 2015. The current usage metrics is available 48-96 hours after online publication and is updated daily on week days.
Initial download of the metrics may take a while.