Fig. 2
Download original image
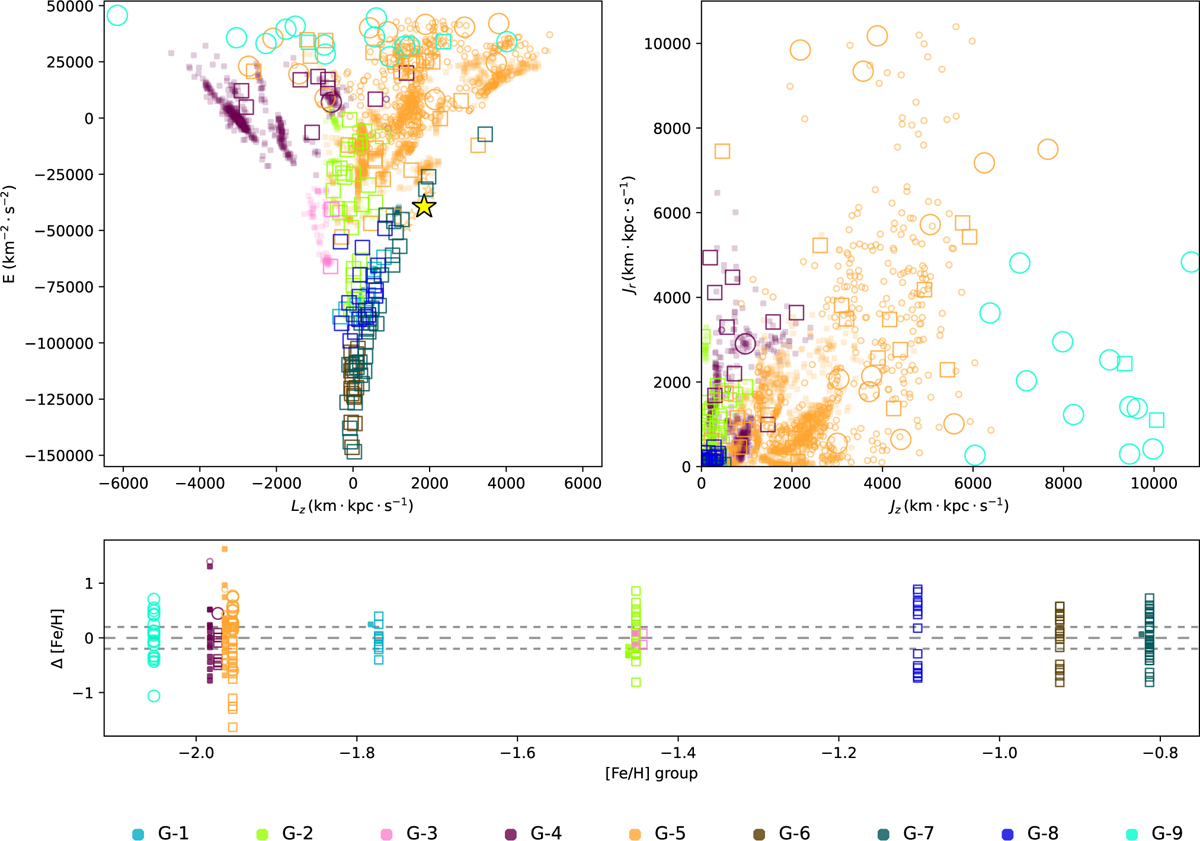
Validation plots for the nine identified groups. Top: kinematic parameter spaces of E–Lz (left panel) and Jr–Jz (right panel). Bottom: differential [Fe/H] of each structure vs the mean [Fe/H] for all structures in the group (see Section 4.2 for a more detailed explanation.) The grey dashed line shows the mean value for each group, and the faint dashed lines show a 0.2 dex dispersion to guide the eye. A horizontal offset of 0.01 dex has been applied between streams and clusters within the groups in order to better visualise the distributions. Structures are coloured consistently with the selection shown in the bottom left panel of Figure 1 and described in Table 2. Filled and open points are stream stars from the STREAMFINDER sample and the S5 sample, respectively. Large open square symbols are GCs and large open circle symbols are Local Group dwarf galaxies.
Current usage metrics show cumulative count of Article Views (full-text article views including HTML views, PDF and ePub downloads, according to the available data) and Abstracts Views on Vision4Press platform.
Data correspond to usage on the plateform after 2015. The current usage metrics is available 48-96 hours after online publication and is updated daily on week days.
Initial download of the metrics may take a while.