Open Access
Fig. B.1
Download original image
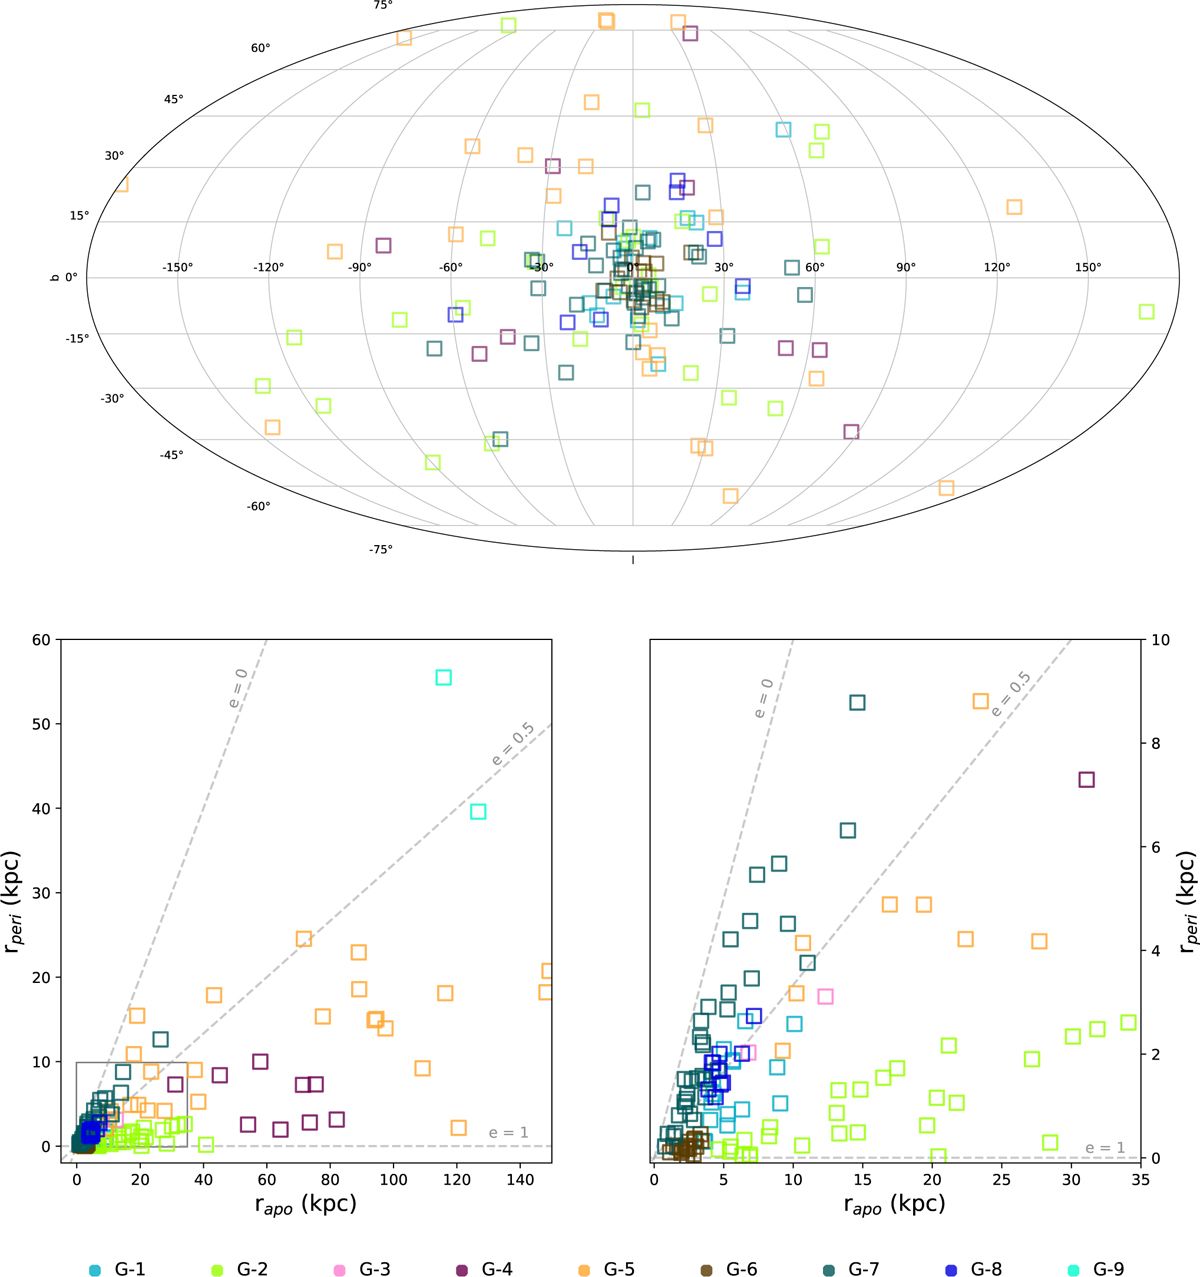
Top: Sky plot showing only the GCs from the selected groups plotted in Galactic coordinates. Bottom left: Galactic pericentre vs apocentre distances for the GCs. Bottom right: Zoomed-in view of the left panel, with axes according to the black box in the left panel. The grey dashed lines show lines of constant eccentricity.
Current usage metrics show cumulative count of Article Views (full-text article views including HTML views, PDF and ePub downloads, according to the available data) and Abstracts Views on Vision4Press platform.
Data correspond to usage on the plateform after 2015. The current usage metrics is available 48-96 hours after online publication and is updated daily on week days.
Initial download of the metrics may take a while.