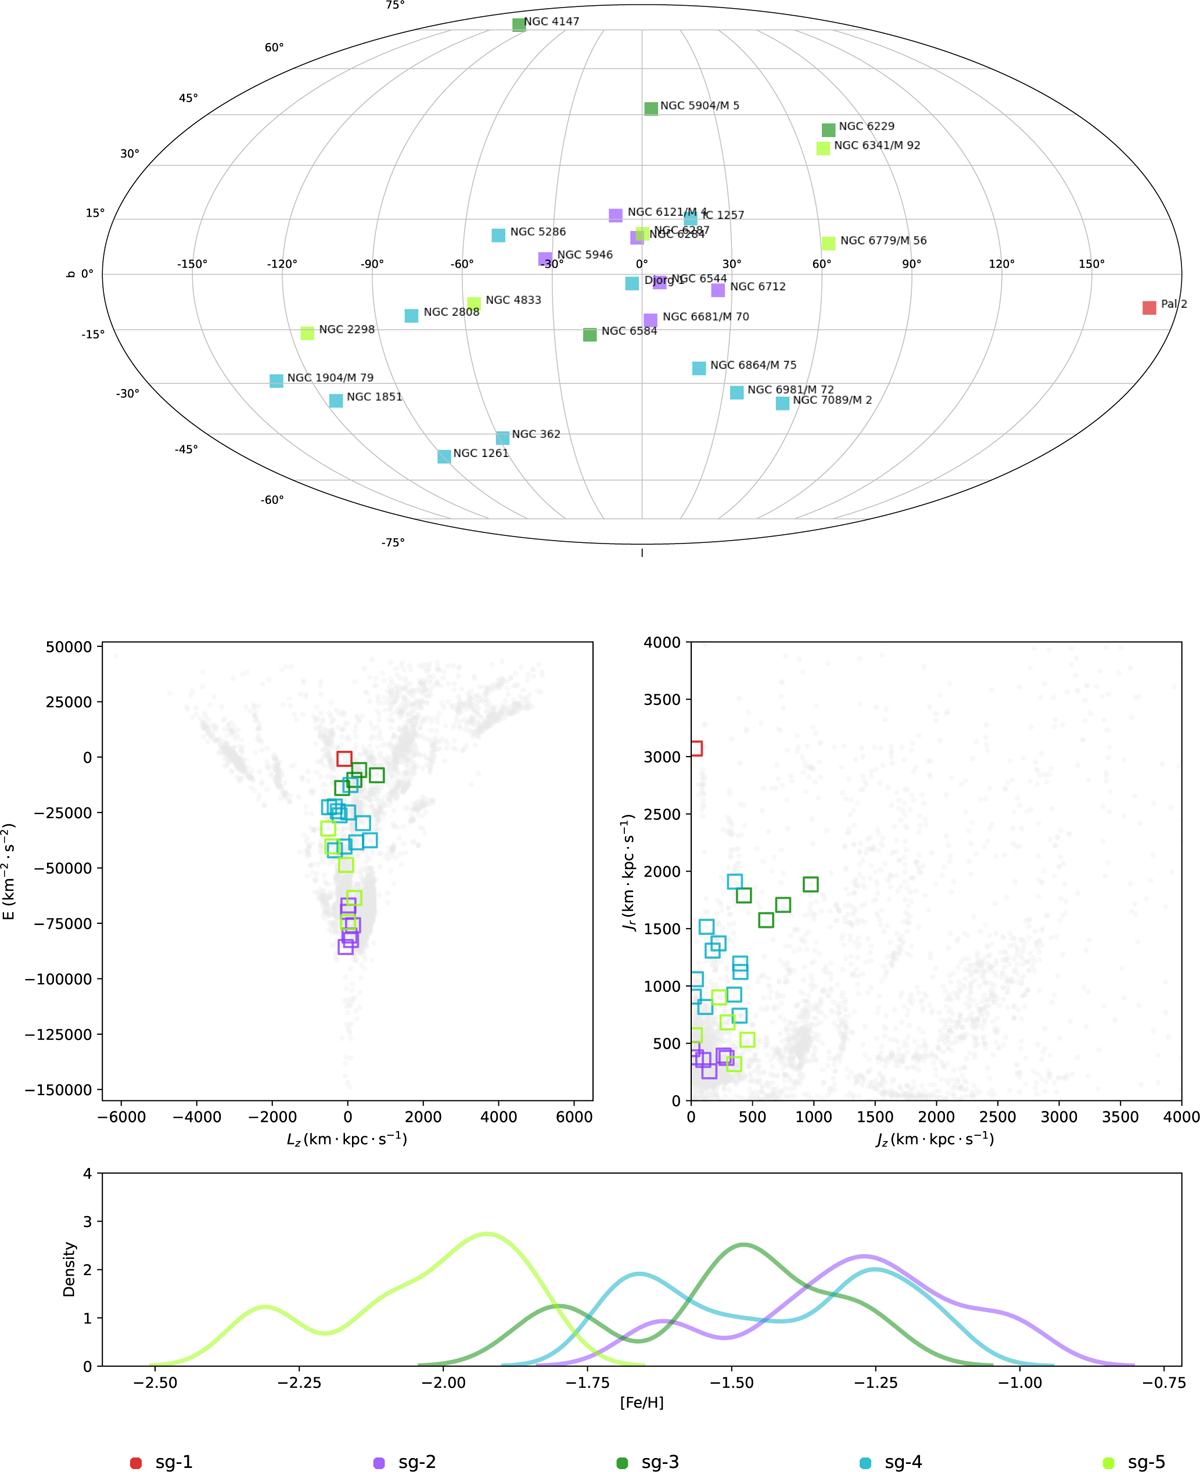
Fig. C.1
Download original image
Top: Globular clusters from the GSE selected subgroups plotted in Galactic coordinates. Middle: Kinematic parameter spaces E–Lz and Jr–Jz are shown in the left and right panels, respectively. Each square symbol represents one GC and the grey points show the rest of the dataset to give context to where these GC populations lie. Bottom: Kernel density estimation of [Fe/H] distributions for each GSE subgroup.
Current usage metrics show cumulative count of Article Views (full-text article views including HTML views, PDF and ePub downloads, according to the available data) and Abstracts Views on Vision4Press platform.
Data correspond to usage on the plateform after 2015. The current usage metrics is available 48-96 hours after online publication and is updated daily on week days.
Initial download of the metrics may take a while.