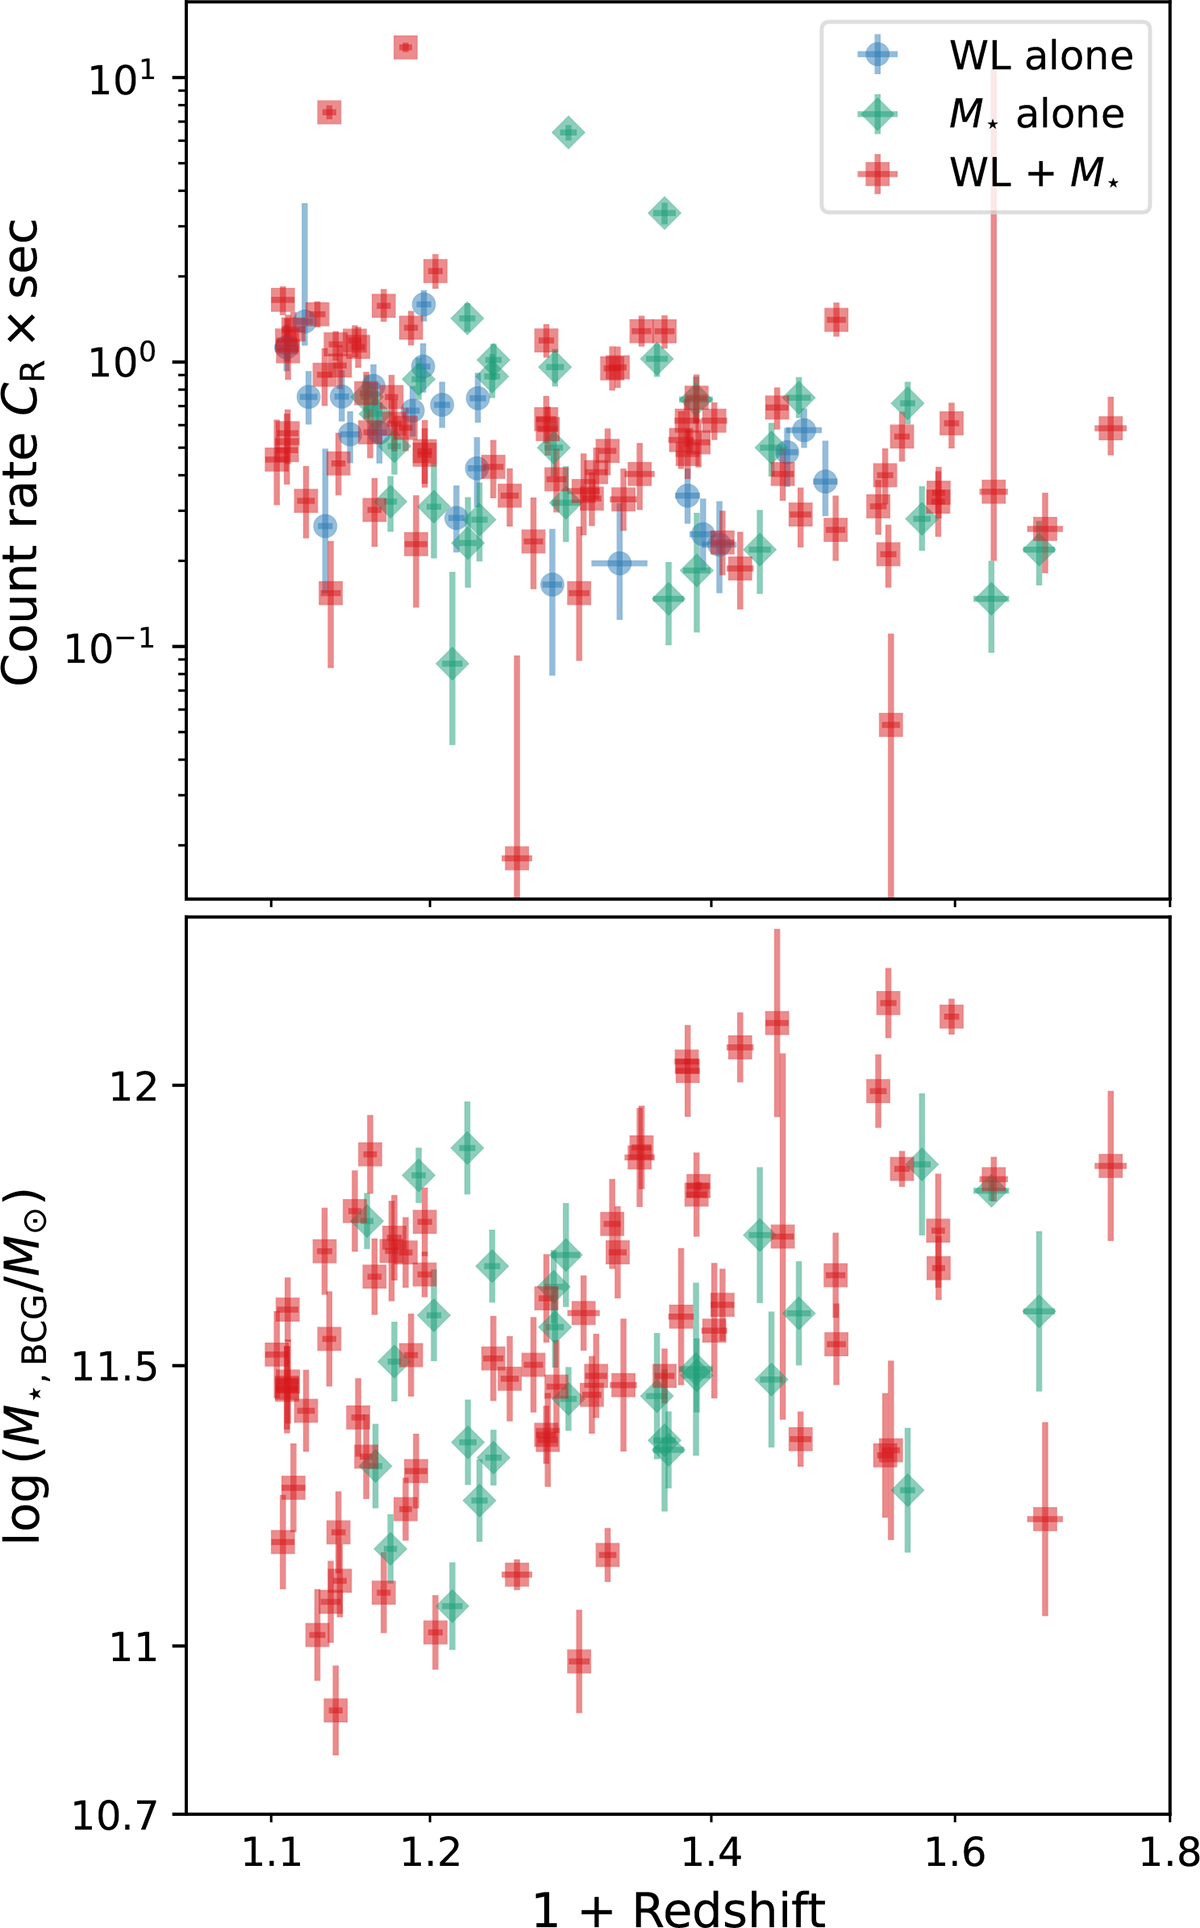
Fig. 2.
Download original image
Distributions of the observed count rate CR (top panel) and the BCG stellar mass M⋆, BCG (left panel) as functions of the cluster redshift for the eRASS1 clusters studied in this work. The clusters are colour-coded as in Fig. 1. We note that a clear dependence of the BCG stellar mass on the cluster redshift is revealed in the bottom panel, which arises from the X-ray selection primarily favoring massive clusters at high redshift.
Current usage metrics show cumulative count of Article Views (full-text article views including HTML views, PDF and ePub downloads, according to the available data) and Abstracts Views on Vision4Press platform.
Data correspond to usage on the plateform after 2015. The current usage metrics is available 48-96 hours after online publication and is updated daily on week days.
Initial download of the metrics may take a while.