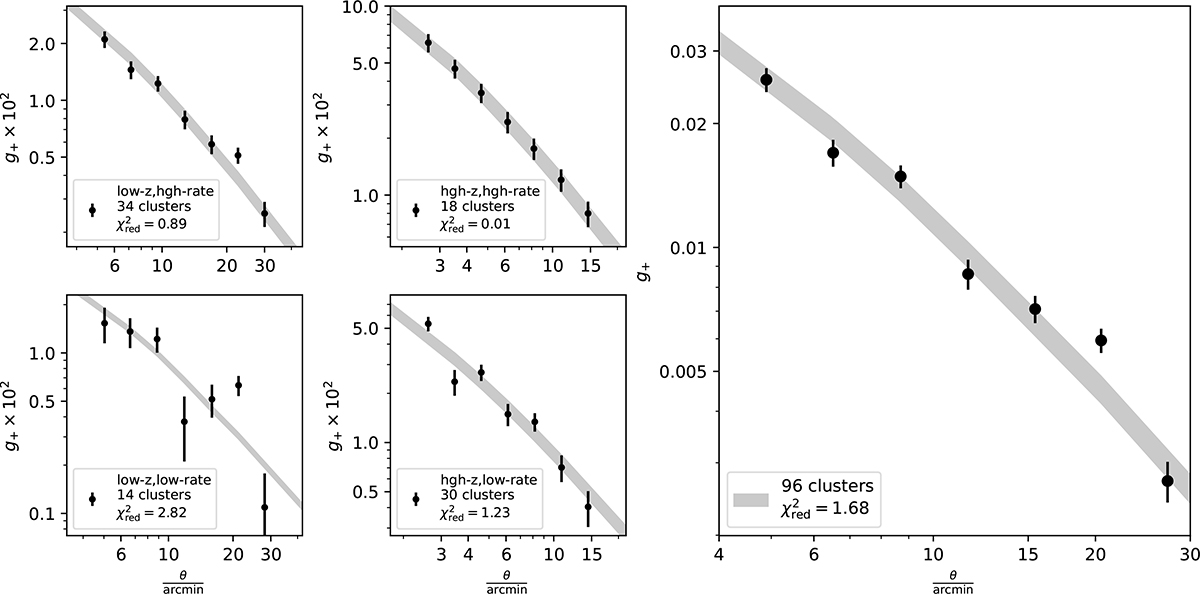
Fig. 4.
Download original image
Observed shear profiles g+ (black data points) and best-fit models with fully marginalized uncertainties (grey shaded regions). The four subplots in the left panel present the stacked profiles of the subsamples defined with respect to the median values of the observed count rate (CR = 0.487) and the redshift (z = 0.27). The stacked profile of all 96 eRASS1 clusters is presented in the right panel. The numbers of the clusters in the (sub)samples and the reduced χred2 are shown in the lower left corners. In both left and right panels, the radial values (the x-axis) of the measurements are obtained with the inverse-variance weights of the clusters in the (sub)samples.
Current usage metrics show cumulative count of Article Views (full-text article views including HTML views, PDF and ePub downloads, according to the available data) and Abstracts Views on Vision4Press platform.
Data correspond to usage on the plateform after 2015. The current usage metrics is available 48-96 hours after online publication and is updated daily on week days.
Initial download of the metrics may take a while.