Fig. 5.
Download original image
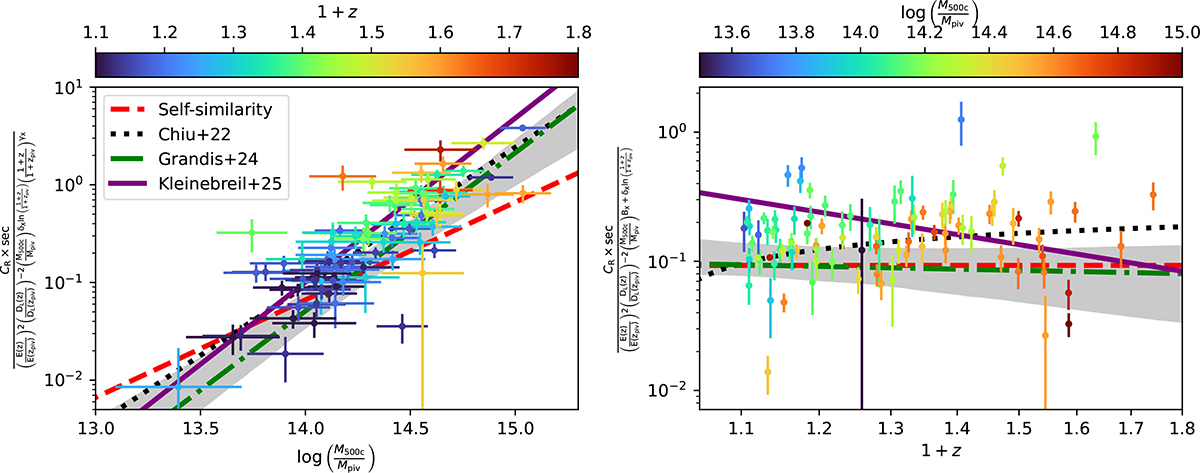
CR–M–z relation of the eRASS1 clusters and the best-fit model in Eq. (22). Its fully marginalized uncertainties are shown as grey shaded regions. The left panel shows the mass trend normalized at the pivotal redshift zpiv = 0.35 after accounting for the redshift-dependent factors, while the right panel similarly presents the redshift scaling normalized at the pivotal mass ![]() . In both panels, the eRASS1 clusters are colour-coded based on the redshift (left panel) and posterior-sampled halo mass (right panel). For comparison, the results from Grandis et al. (2024, green dash-dotted lines) and Kleinebreil et al. (2025, purple lines), which are based on the weak-lensing mass calibration from the DES and KiDS surveys, respectively, are also plotted. The observed CR–M–z relation reveals a mass trend that is steeper than the self-similar prediction (red dashed line), while its redshift trend remains statistically consistent with the self-similar scaling. The normalization of the self-similar predictions (red dashed lines) is fixed to the best-fit AX.
. In both panels, the eRASS1 clusters are colour-coded based on the redshift (left panel) and posterior-sampled halo mass (right panel). For comparison, the results from Grandis et al. (2024, green dash-dotted lines) and Kleinebreil et al. (2025, purple lines), which are based on the weak-lensing mass calibration from the DES and KiDS surveys, respectively, are also plotted. The observed CR–M–z relation reveals a mass trend that is steeper than the self-similar prediction (red dashed line), while its redshift trend remains statistically consistent with the self-similar scaling. The normalization of the self-similar predictions (red dashed lines) is fixed to the best-fit AX.
Current usage metrics show cumulative count of Article Views (full-text article views including HTML views, PDF and ePub downloads, according to the available data) and Abstracts Views on Vision4Press platform.
Data correspond to usage on the plateform after 2015. The current usage metrics is available 48-96 hours after online publication and is updated daily on week days.
Initial download of the metrics may take a while.