Fig. 9.
Download original image
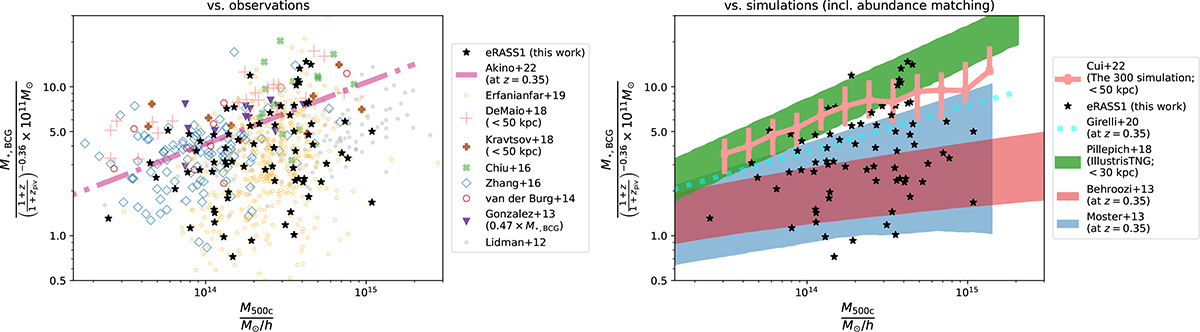
Comparisons of the mass trend of the BCG stellar mass between the eRASS1 clusters and previous observational (left panel) and simulation-based (right panel) studies. In both panels, the mass trend is re-normalized at the pivotal redshift (zpiv = 0.35) using the best-fit M⋆, BCG–M–z relation as in Eq. (24). The eRASS1 clusters are indicated by black stars, while previous studies are shown according to the lists to the right of each panel.
Current usage metrics show cumulative count of Article Views (full-text article views including HTML views, PDF and ePub downloads, according to the available data) and Abstracts Views on Vision4Press platform.
Data correspond to usage on the plateform after 2015. The current usage metrics is available 48-96 hours after online publication and is updated daily on week days.
Initial download of the metrics may take a while.