Fig. 3.
Download original image
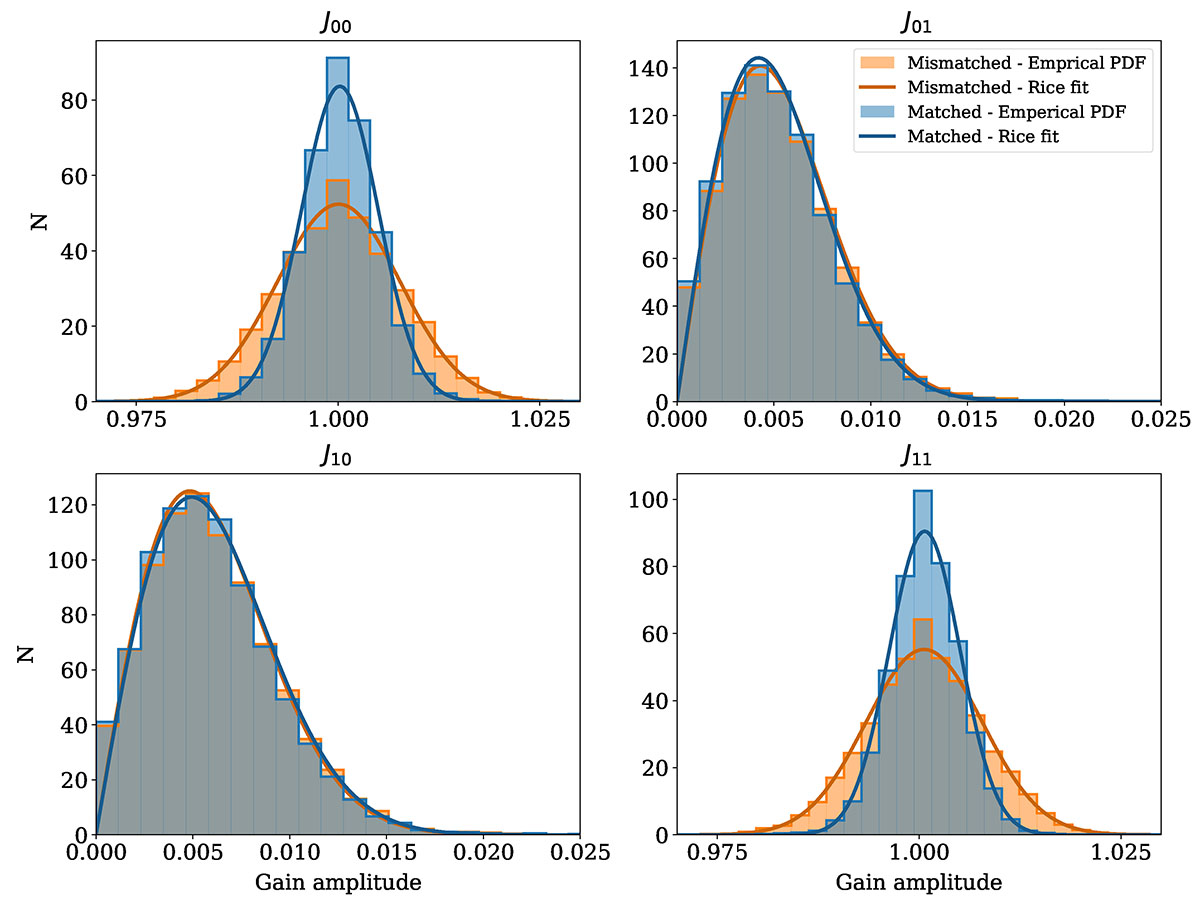
Normalized histograms of the gain amplitudes at 152 MHz for all stations and time solutions. Solid lines show Rice distribution fits for each calibration scenario. Each panel represents a matrix element of the Jones matrix. The gains are referenced to the core station CS001HBA1 by multiplying them with the inverse gain matrix of CS001HBA1. The blue histogram shows the empirical PDF of gain amplitude solutions for the ground-truth case, obtained by forward-simulating and calibrating with a PSO sky model. The orange histogram shows the empirical PDF for gain solutions from simulations using a PSDE sky model but calibrated with a PSO model, thus omitting diffuse Galactic emission during the DI gain calibration, as described in the text.
Current usage metrics show cumulative count of Article Views (full-text article views including HTML views, PDF and ePub downloads, according to the available data) and Abstracts Views on Vision4Press platform.
Data correspond to usage on the plateform after 2015. The current usage metrics is available 48-96 hours after online publication and is updated daily on week days.
Initial download of the metrics may take a while.