Open Access
Fig. 4.
Download original image
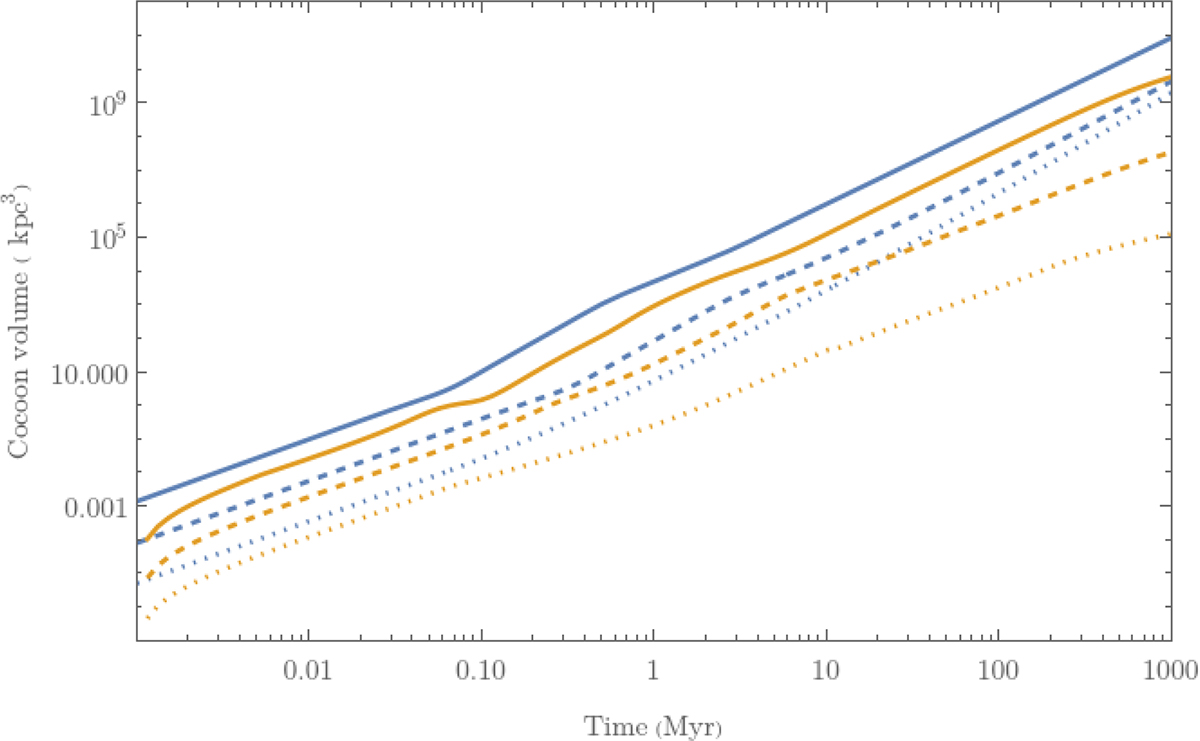
Evolution of the cocoon’s total volume (blue) and the emitting volume Vc(t) (orange) for different jet powers L0: 1039 W (solid curves), 1037 W (dashed curves), and 1035 W (dotted curves).
Current usage metrics show cumulative count of Article Views (full-text article views including HTML views, PDF and ePub downloads, according to the available data) and Abstracts Views on Vision4Press platform.
Data correspond to usage on the plateform after 2015. The current usage metrics is available 48-96 hours after online publication and is updated daily on week days.
Initial download of the metrics may take a while.