Fig. 1
Download original image
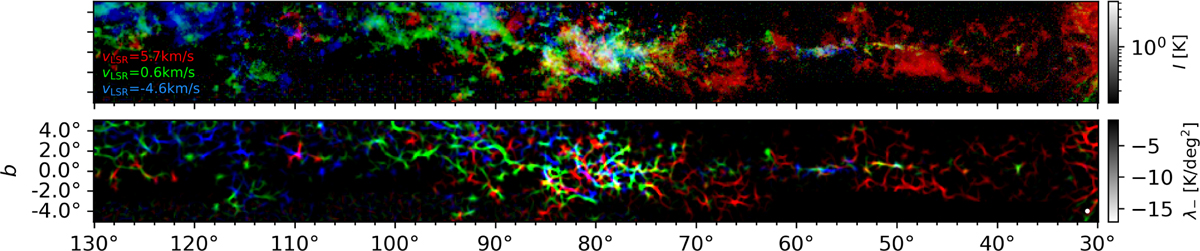
Example of 12CO(1–0) line emission intensity (top) and the corresponding filamentary structures identified using the Hessian matrix method (bottom) toward a portion of the Galactic plane. The map shown in each color corresponds to the emission in a 1.29-km s−1-wide channel centered on the line-of-sight velocity indicated on the left-hand side of the top panel.
Current usage metrics show cumulative count of Article Views (full-text article views including HTML views, PDF and ePub downloads, according to the available data) and Abstracts Views on Vision4Press platform.
Data correspond to usage on the plateform after 2015. The current usage metrics is available 48-96 hours after online publication and is updated daily on week days.
Initial download of the metrics may take a while.