Open Access
Fig. C.1
Download original image
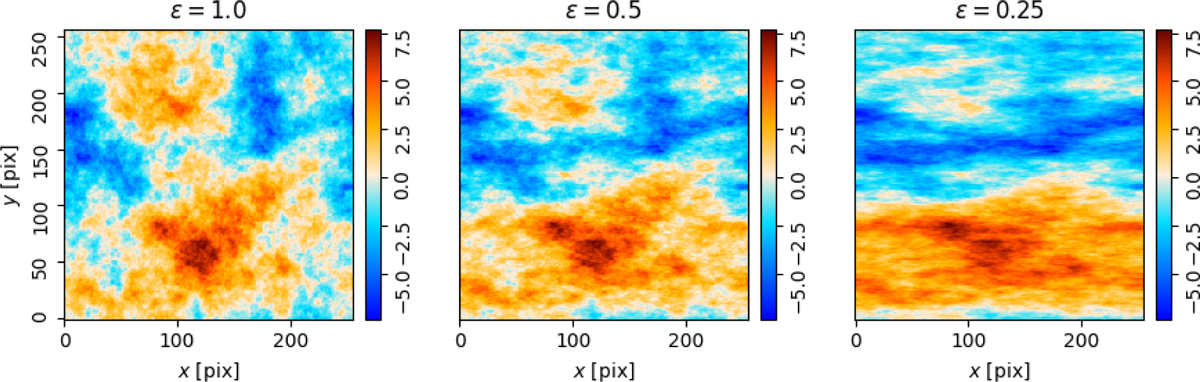
Synthetic emission maps produced using fBm realizations with a power spectrum slope α = 3.0, anisotropy angle θ = 0°, and ellipticities ϵ = 1.0, 0.5, and 0.25, shown from left to right. The colorbar corresponds to the amplitude of these synthetic scalar fields with mean equal to zero.
Current usage metrics show cumulative count of Article Views (full-text article views including HTML views, PDF and ePub downloads, according to the available data) and Abstracts Views on Vision4Press platform.
Data correspond to usage on the plateform after 2015. The current usage metrics is available 48-96 hours after online publication and is updated daily on week days.
Initial download of the metrics may take a while.