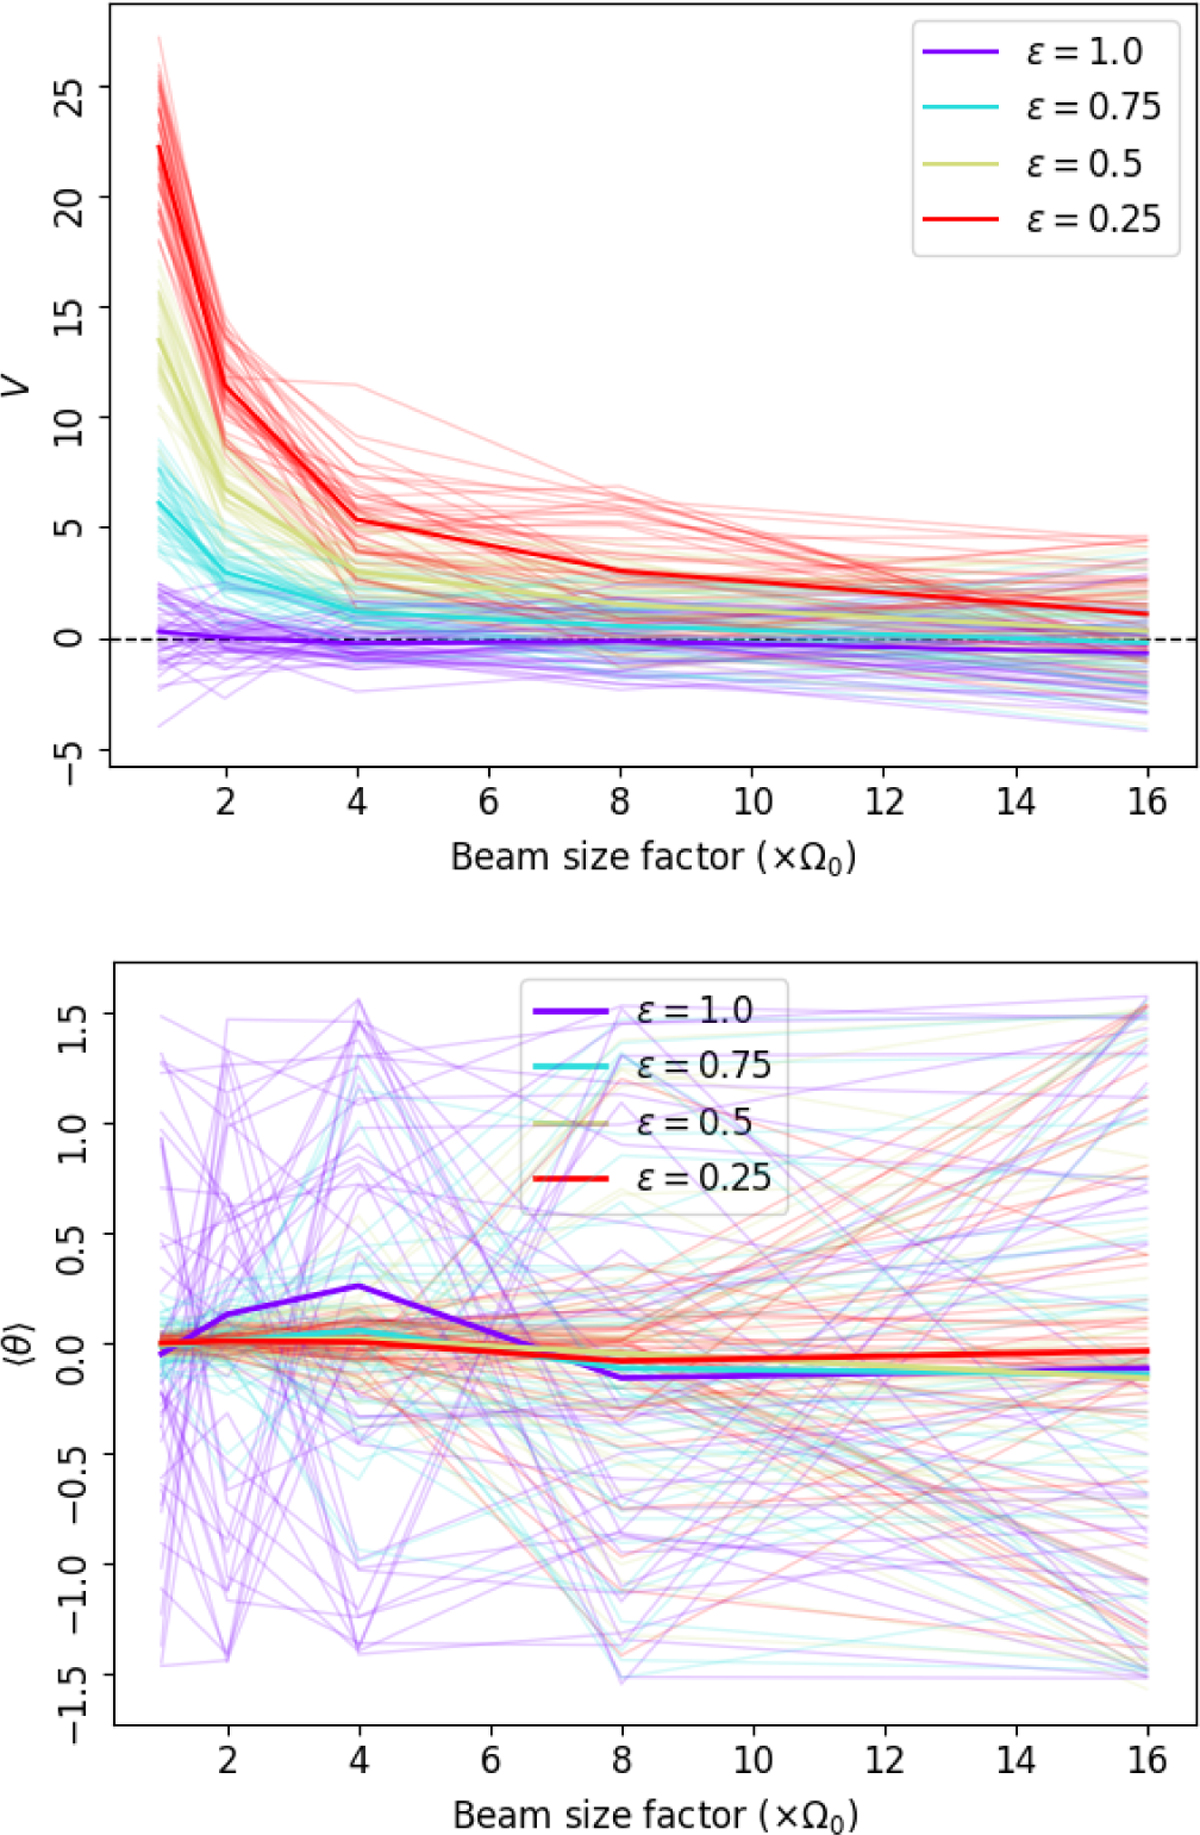
Fig. C.2
Download original image
Anisotropy quantified by the projected Rayleigh statistic (V, top) and the mean orientation angle (⟨θ⟩, bottom) for the filamentary structures in fBm maps with ellipticities, ϵ, and for different beam sizes above the derivative kernel size Ω0 = 18′. For each color, the narrow lines correspond to the 48 fBm realizations and the broad line to the mean value of the realizations.
Current usage metrics show cumulative count of Article Views (full-text article views including HTML views, PDF and ePub downloads, according to the available data) and Abstracts Views on Vision4Press platform.
Data correspond to usage on the plateform after 2015. The current usage metrics is available 48-96 hours after online publication and is updated daily on week days.
Initial download of the metrics may take a while.