Fig. 3
Download original image
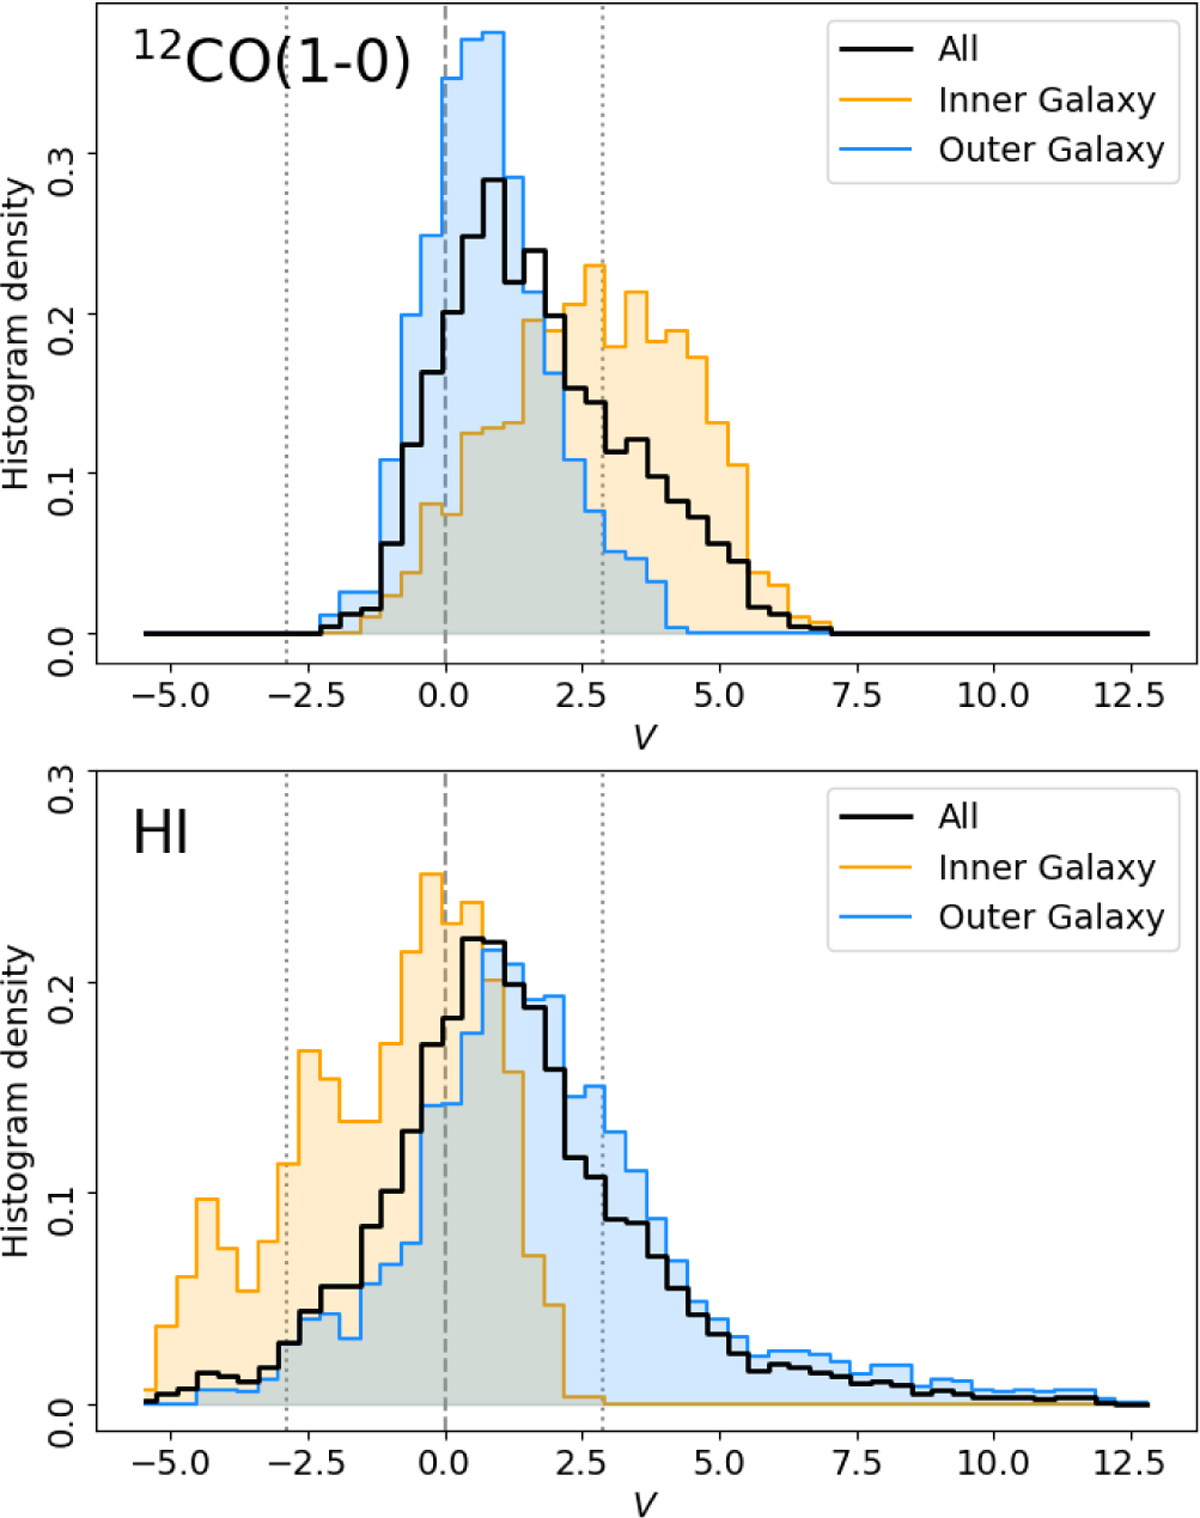
Normalized histogram of V distribution across 10° × 10° × 1.29-km s−1 tiles for 12CO(1–0) (top), corresponding to values presented in the left-hand panel of Fig. 2, and HI, corresponding to Figure A.3 in Soler et al. (2022). The dashed vertical line marks V = 0, which corresponds to no preferential orientation either parallel or perpendicular to the Galactic plane. The dotted vertical lines indicate V = ±2.87, which correspond to the 3σ significance levels for preferential orientation parallel or perpendicular to the Galactic plane, respectively.
Current usage metrics show cumulative count of Article Views (full-text article views including HTML views, PDF and ePub downloads, according to the available data) and Abstracts Views on Vision4Press platform.
Data correspond to usage on the plateform after 2015. The current usage metrics is available 48-96 hours after online publication and is updated daily on week days.
Initial download of the metrics may take a while.