Fig. 6
Download original image
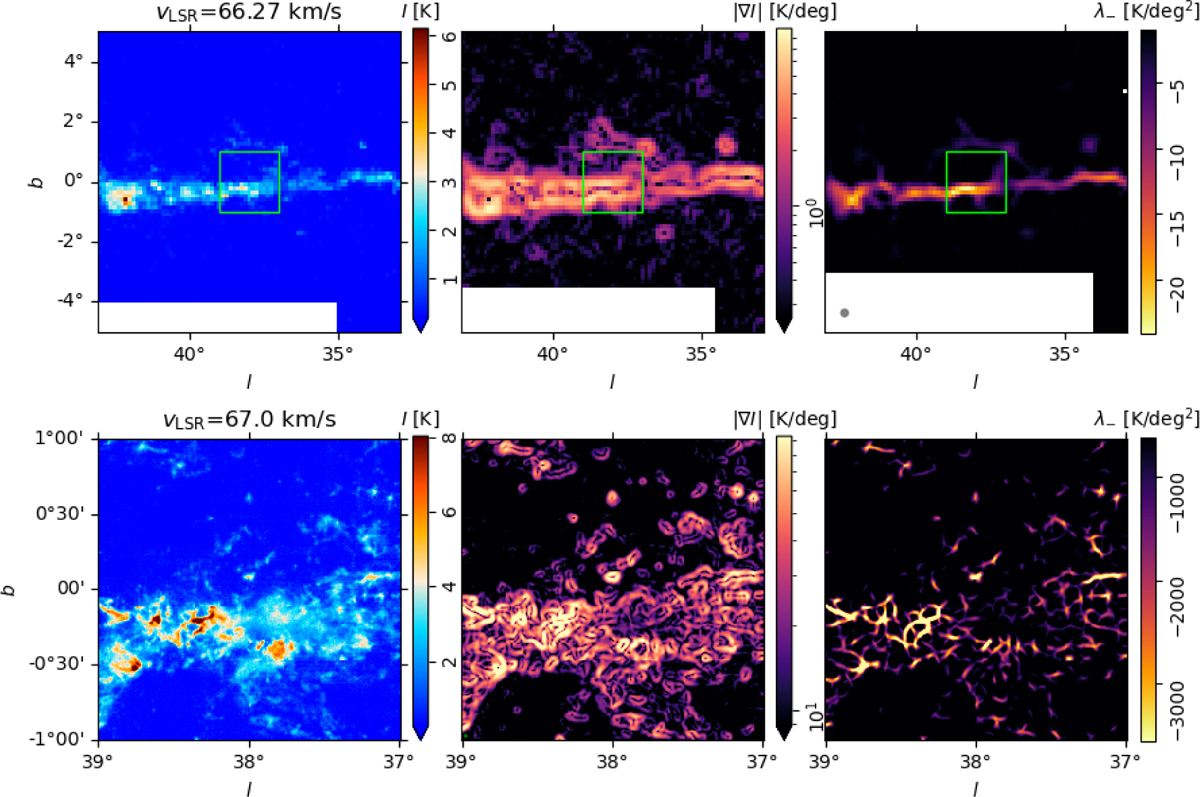
Example of a tile with CO emission structures mostly parallel to the Galactic plane, as identified by the highest V values in the left panel of Fig. 2. The top panels show the 12CO(1–0) line emission at 7.′5 FWHM resolution in the Dame et al. (2001) composite survey. The bottom panels show the 12CO(1–0) line emission at 55′′ FWHM resolution in the MWISP survey toward the region marked with the green square in the top panel. The left, middle, and right panels show the line emission map, its gradient, and the filamentary structures identified by the second eigenvalue of the Hessian matrix (Eq. (2)) respectively.
Current usage metrics show cumulative count of Article Views (full-text article views including HTML views, PDF and ePub downloads, according to the available data) and Abstracts Views on Vision4Press platform.
Data correspond to usage on the plateform after 2015. The current usage metrics is available 48-96 hours after online publication and is updated daily on week days.
Initial download of the metrics may take a while.