Open Access
Fig. 8
Download original image
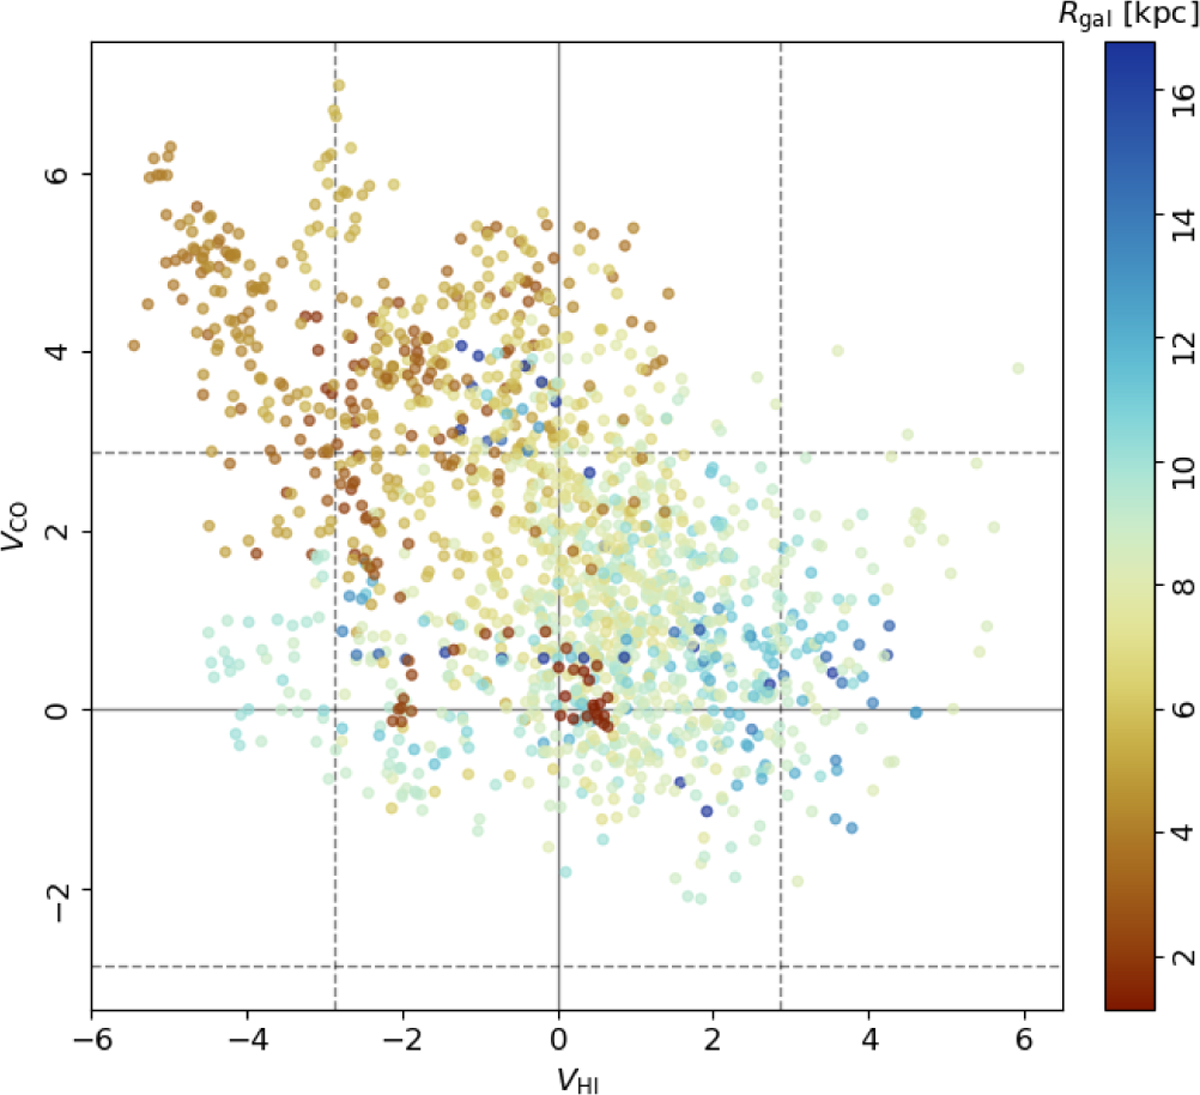
Comparison of the preferential orientation obtained with the projected Rayleigh statistic (V, Eq. (4)) applied to 12CO(1–0) and HI observations. The latter corresponds to the results reported by Soler et al. (2020) for the same tile size and derivative kernel size. Colors indicate the Galactocentric distances of each tile.
Current usage metrics show cumulative count of Article Views (full-text article views including HTML views, PDF and ePub downloads, according to the available data) and Abstracts Views on Vision4Press platform.
Data correspond to usage on the plateform after 2015. The current usage metrics is available 48-96 hours after online publication and is updated daily on week days.
Initial download of the metrics may take a while.