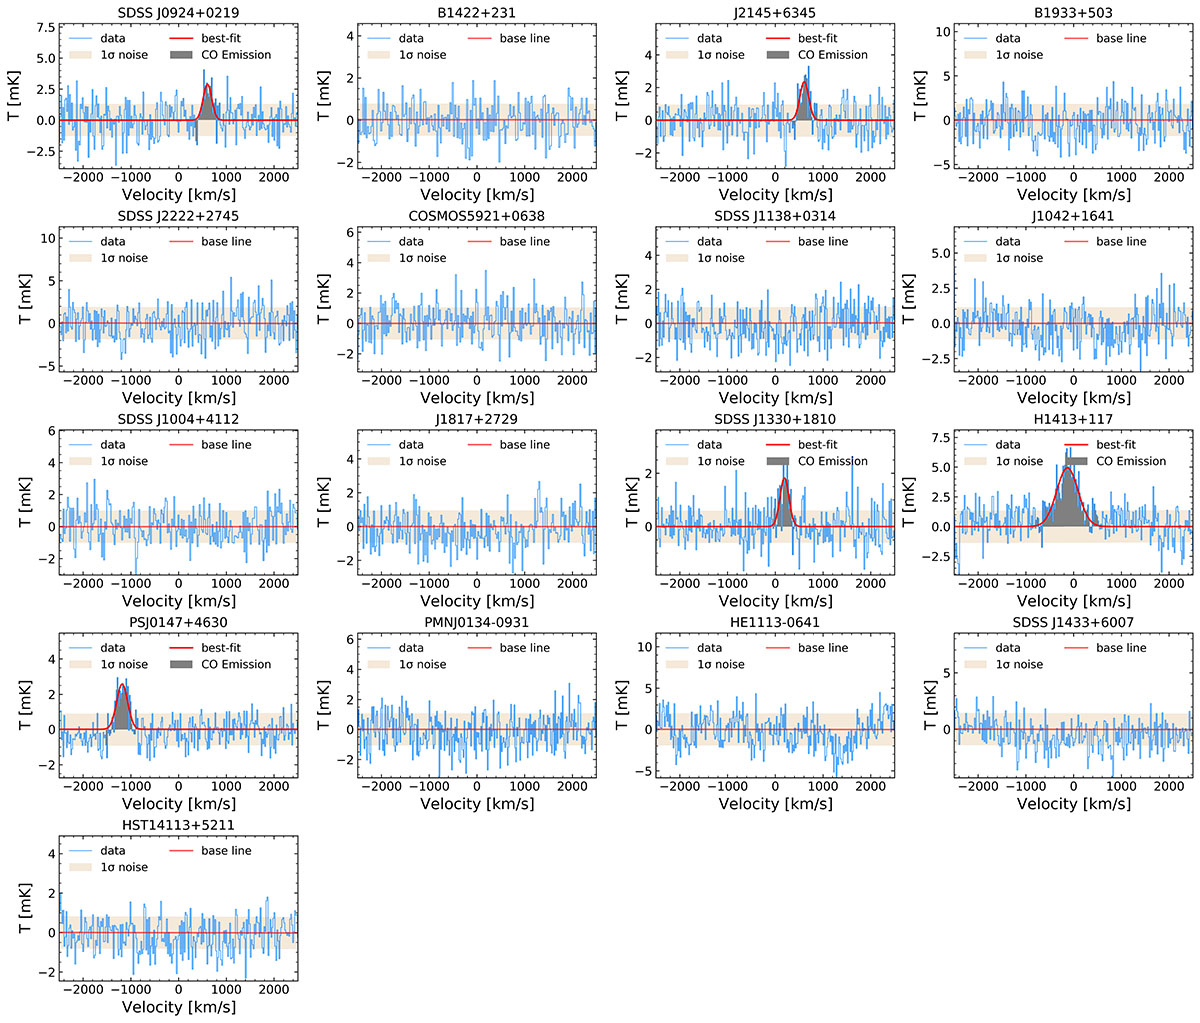
Fig. 1.
Download original image
Observed spectra in a velocity range from −2500 km s−1 to 2500 km s−1 of all objects, where the zero velocity is the optical redshift. The background blue curves are the stacked and smoothed spectra. The orange shadow represents the 1σ standard deviation of the continuum, and the gray region marks the CO emission line. The best-fit Gaussian profile is marked by the red curve.
Current usage metrics show cumulative count of Article Views (full-text article views including HTML views, PDF and ePub downloads, according to the available data) and Abstracts Views on Vision4Press platform.
Data correspond to usage on the plateform after 2015. The current usage metrics is available 48-96 hours after online publication and is updated daily on week days.
Initial download of the metrics may take a while.