Fig. 3.
Download original image
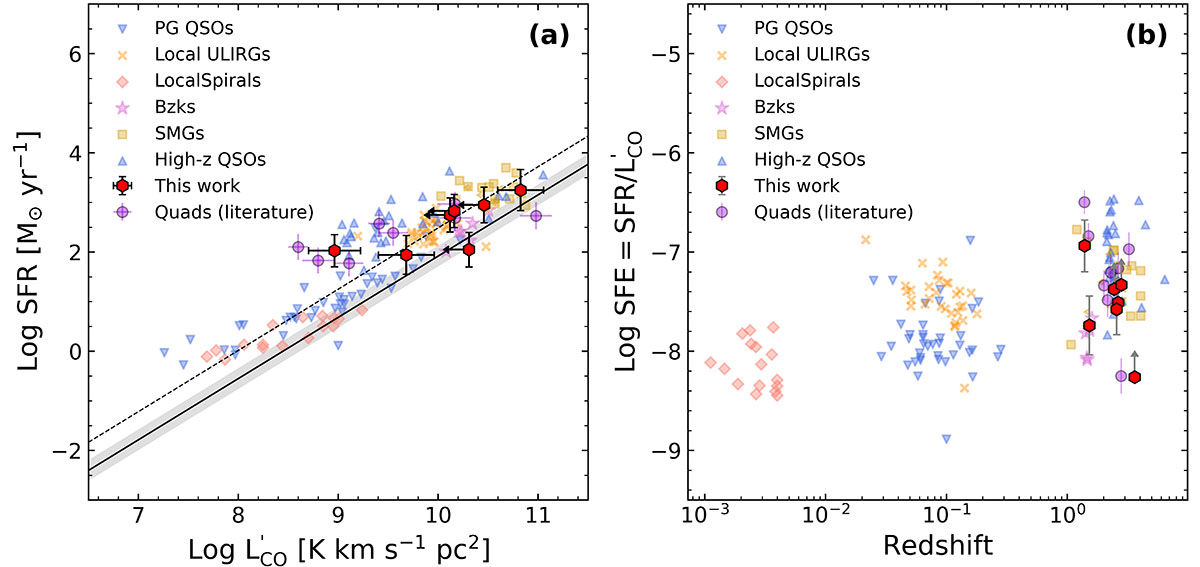
Comparison of star-forming activity between our sample and other representative galaxy samples. (a) CO J = 1-0 vs. SFR. The solid black line shows the SFMS with 1 σ scatter, and the dotted black line shows the starburst trend (Sargent et al. 2014). (b) Star formation efficiency (![]() ) as a function of redshift. Various galaxy samples include the Bzk galaxies (Daddi et al. 2010), SMGs (Greve et al. 2005; Daddi et al. 2009b,a), luminous high-redshift quasars (Solomon & Vanden Bout 2005; Riechers et al. 2006), local PG quasars (Shangguan et al. 2018, 2020), local ULIRGs (Solomon et al. 1997), local spirals (Leroy et al. 2008, 2009; Wilson et al. 2009), and Quads lensed quasars from the literature (Barvainis et al. 1997, 2002; Ao et al. 2008; Bradford et al. 2009; Riechers 2011; Deane et al. 2013; Paraficz et al. 2018; Stacey et al. 2020, 2021, 2022; Frias Castillo et al. 2024).
) as a function of redshift. Various galaxy samples include the Bzk galaxies (Daddi et al. 2010), SMGs (Greve et al. 2005; Daddi et al. 2009b,a), luminous high-redshift quasars (Solomon & Vanden Bout 2005; Riechers et al. 2006), local PG quasars (Shangguan et al. 2018, 2020), local ULIRGs (Solomon et al. 1997), local spirals (Leroy et al. 2008, 2009; Wilson et al. 2009), and Quads lensed quasars from the literature (Barvainis et al. 1997, 2002; Ao et al. 2008; Bradford et al. 2009; Riechers 2011; Deane et al. 2013; Paraficz et al. 2018; Stacey et al. 2020, 2021, 2022; Frias Castillo et al. 2024).
Current usage metrics show cumulative count of Article Views (full-text article views including HTML views, PDF and ePub downloads, according to the available data) and Abstracts Views on Vision4Press platform.
Data correspond to usage on the plateform after 2015. The current usage metrics is available 48-96 hours after online publication and is updated daily on week days.
Initial download of the metrics may take a while.